University of Colorado
University of Colorado: Ph Et Interactive Simulations: The Moving Man, Motion, Velocity, Acceleration, Position
Enhance study of motion, velocity, acceleration, position and graphing with this interactive simulation.
CK-12 Foundation
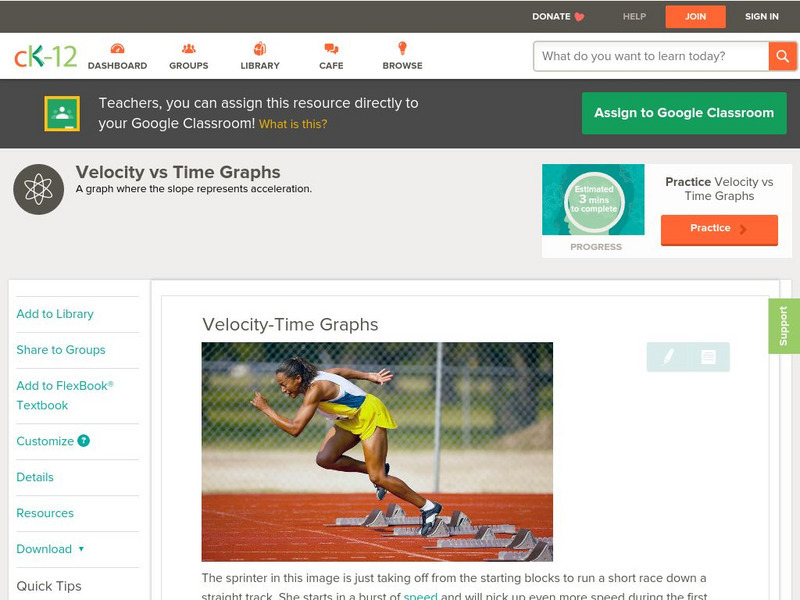
Ck 12: Physical Science: Velocity Time Graphs
[Free Registration/Login may be required to access all resource tools.] How to draw a velocity-time graph and what it represents.
Physics Classroom
The Physics Classroom: 1 D Kinematics: Kinematic Equations and Graphs
In this interactive physics tutorial, students investigate the relationships between two methods available to solve problems involving the numerical relationships between displacement, velocity, acceleration and time.
Science Education Resource Center at Carleton College
Serc: Student Analysis: Determine the Acceleration of a Toy Car
For this activity, learners measure the displacement and elapsed time of a moving toy car using a direct measurement video with an embedded frame counter. They then calculate average and final velocity, and the average acceleration, and...
Science Education Resource Center at Carleton College
Serc: Graphing 1 D Kinematic Motion
In this demonstration students are given a position, velocity, or acceleration graph showing the motion of an object. They describe the motion, and then make predictions by completing the remaining two graphs. Using a motion detector and...
Science Education Resource Center at Carleton College
Serc: Motion: Investigating Motion Graphs
For this lesson, students investigate motion graphs. Students predict what the distance-time graph and velocity time graph would look like for a student walking across the room for three different scenarios.
Science Education Resource Center at Carleton College
Serc: Graph Predictions for Position, Velocity and Acceleration
Students interactively create predictions of position, velocity, and acceleration graphs using java applets. The applets automatically classify student answers, so instructors can create graphs of student predictions.
Texas Education Agency
Texas Gateway: Speed, Velocity, and Acceleration
Given descriptions, illustrations, graphs, charts, or equations, students will differentiate between speed, velocity, and acceleration.
Physics Classroom
The Physics Classroom: 1 D Kinematics: Determining the Area on a v T Graph
In this interactive physics tutorial, students learn how a plot of velocity versus time can also be used to determine the displacement of an object.
Science Education Resource Center at Carleton College
Serc: Investigating Motion Graphing Speed
In this introduction to motion activity, students will get a personal understanding of speed and acceleration by experiencing it firsthand. Wheeled office chairs or other cart like devices are used to give one student a ride as a fellow...
Khan Academy
Khan Academy: 2 D Projectile Motion: Identifying Graphs for Projectiles
Match graphs with the correct scenario for the projectile motion by understanding velocity, acceleration, and displacement.
CK-12 Foundation
Ck 12 Exploration Series: Simulations: Physics: Archery
[Free Registration/Login Required] Watch this animation as an archer shoots at a target on an angle, and its horizontal and vertical paths and its velocity are explained. An interactive follows where you can manipulate the archer's...
Khan Academy
Khan Academy: What Are Velocity vs. Time Graphs?
How to analyze graphs that relate velocity and time to acceleration and displacement.
Khan Academy
Khan Academy: Calculating Average Acceleration From Graphs
Practice calculating acceleration from velocity vs. time graphs
Texas Instruments
Texas Instruments: Making Motion Graphs With Toys
Intended for the beginning lessons in derivative and function graphs, this activity uses motion detectors and battery operated toy cars to generate constant velocity graphs on a TI-83/84. Then students take a free-wheeling car and roll...
Physics Classroom
The Physics Classroom: 1 D Kinematics: Rightward Velocity and Acceleration
Through an animated illustration of a dot diagram and time graphs, students learn about positive velocity and positive acceleration.
Physics Aviary
Physics Aviary: Motion Graph Matching
You will be given a velocity vs. time graph for the motion of a car. Your job is to match the graph with your car by pushing on the gas or brake or coasting at the appropriate moments. Before you start the matching game, you must set the...
Science Education Resource Center at Carleton College
Serc: Newton's Second Law: How Does Acceleration Change With Varying Forces?
In this lab activity, students investigate the effects of changing force on the acceleration of a lab cart testing Newton's Second Law of Motion. They will use distance and time to calculate velocity and create a graph representing their...
TeachEngineering
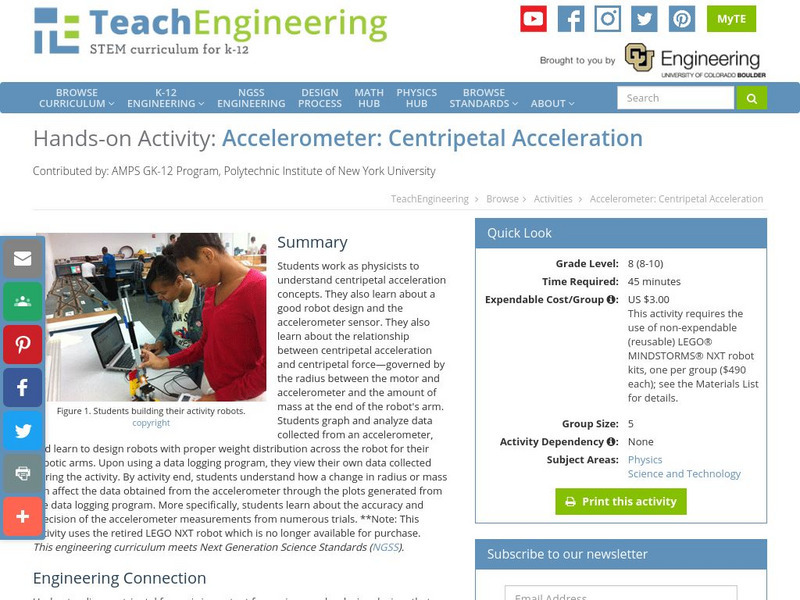
Teach Engineering: Accelerometer: Centripetal Acceleration
Students work as physicists to understand centripetal acceleration concepts. They also learn about a good robot design and the accelerometer sensor. They also learn about the relationship between centripetal acceleration and centripetal...
Physics Classroom
The Physics Classroom: 1 D Kinematics: Table of Contents
Learners examine motion with words, equations, diagrams, and graphs. Some topics investigated are position, velocity, acceleration, and free fall. The tutorial consists of lessons and problems to check for understanding.
Texas Instruments
Texas Instruments: Classroom Activities: Parachuting
This activity explores a parachutist and her position, velocity and acceleration. Graphing and calculating these functions will be required.
BBC
Bbc: Gcse Bitesize: Describing Motion Aqa
This lesson focuses on Distance-time graphs; the gradient of a distance-time graph represents the speed of an object.
Math Graphs
Houghton Mifflin: Math Graphs: Position, Velocity, and Acceleration [Pdf]
Students investigate the position, velocity, and acceleration graphs. The graphs are available in PDF format.
Texas Education Agency
Texas Gateway: Changes in Motion
In this lesson, you will learn about position vs. time graphs and velocity vs. time graphs and how to use them to solve problems.

