Alabama Learning Exchange
How Big Can a Bee Be?
Mathematicians analyze the relationships between surface area and volume. They conduct Internet research, conduct various experiments, record the data in a spreadsheet, and graph the results and compare the rate of increase of surface...
Curated OER
Make Your Fortune in Stocks
Fourth graders participate in a stock investment activity in which they research stocks to place in an imaginary portfolio. They invest $10,000 in a variety of stocks and track their progress using the Internet or newspapers.
EngageNY
Sampling Variability in the Sample Mean (part 2)
Reduce variability for more accurate statistics. Through simulation, learners examine sample data and calculate a sample mean. They understand that increasing the number of samples creates results that are more representative of the...
Curated OER
Historical Population Changes in the US
High schoolers conduct research on historical population changes in the U.S. They conduct Internet research on the Historical Census Data Browser, create a bar graph and data table using a spreadsheet program, and display and interpret...
Curated OER
All The Bell & Whistles
Young adults are so eager to get that first cell phone. And, cell phones have so many cool extras! Learners conduct real-life research to determine which cell phone carrier offers the best deals on things like wall paper, ringtones, and...
Curated OER
Data Analysis and Probability: Graphing Candy with Excel
Collect and graph data using Microsoft Excel with your math class. They will make predictions about the number of each colored candy in a bag of M&M's, then sort, classify, count, and record the actual data before using Excel to...
Curated OER
Looking at Circumference
Learners understand where the number for pi comes from. They understand and use the formula for circumference. Students measure the circles given out and the diameters of those circles and record the results on their worksheet.
Curated OER
How Credit Card Interest Works
Students experiment with an Excel spreadsheet model that demonstrates the effects of interest on payments. They calculate actual costs, interest paid, and time necessary to pay off credit purchases and draw conclusions about the...
Curated OER
Discovering Pi
Define terminology related to a circle. Practice accuracy in measuring and then create a spreadsheet based on data collected from solving for parts of a circle. Groups can have fun analyzing their data as it relates to Pi.
Curated OER
Does Humidity Affect Cloud Formation?
Students use S'COOL data to identify factors that affect cloud formation. They find a data set using the S'COOL database , and use Excel to manipulate the data. Student isolate relevant data, create meaningful graphs from a spreadsheet,...
Curated OER
Birds, Fractions and Percentages
Students study fractions, percentages, spreadsheets, and computers by watching and recording the number of species of birdsseen. They create a spreadsheet to record the results of their one month study.
Curated OER
Counting Coins
Second graders identify a quarter, dime, penny, nickel, and dime. They match the coin with it's monetary value, collect data on excel spreadsheet, and create a graph in Excel. Students participate in group activities.
Curated OER
A Comparison Study of Water Vapor Data to Precipitation over North America
Students use NASA satellite data to compare water vapor over the United States. In this data analysis lesson students use an Excel spreadsheet to map their data.
Curated OER
Loan Amortization - Mortgage
Upper graders explore the connection between interest and principal. They use an amortization schedule to determine the amount of principal paid vs interest on a $100,000 home loan. Fourteen discussion questions and a research-based...
Curated OER
A Simple Model for Natural Selection
Do you have what it takes to survive as a fit predator or will elusive prey lead to your extinction? Find out in a creative natural selection activity. Using different colors and shapes of grains to represent different species and...
Curated OER
Sampling Bias And the California Recall
Using a 2002 California Gray David recall vote as an example, young statisticians identify sources of bias in samples and find ways of reducing and eliminating sampling bias. They consider ways to select random samples from a...
Curated OER
"Living in the Limelight The Universal Dream"
Students, using Leo's Lyrics, investigate common themes in popular music. They create a Microsoft Excel spreadsheet that analyzes their findings along with a 200 word paragraph stating their observations, conclusions and hypotheses about...
Curated OER
Math Hunt
Go on a scavenger hunt around your school to find evidence of math. Investigate different areas of your school for patterns, fractions, and different geometric shapes. Finally, create a spreadsheet and plot the data you've collected.
Curated OER
Thinking Outside the Box
Now this lesson sounds fun! Students throw a ball, film it as it soars through the air, and use a spreadsheet to collect data. A scatterplot is created to produce a quadratic regression equation, an equation in vertex form, and an...
Alabama Learning Exchange
Bloodstain Pattern Doesn't Lie......
An interesting instructional activity on hypothesizing about the diameter of a drop of blood that is splattered. To test their theories, learners work in groups to make blood droplets splatter from different heights. They use graphed...
Curated OER
Level III: Technology Integration
Fourth graders prepare two spreadsheets each with an embedded line graph that displays data about the growth of the bitter rot fungus on apples and on petri dishes that were stored in the refrigerator and the classroom. They prepare a...
Curated OER
Conversation Heart Graphing
Sixth graders review the different types of graphs (bar, line, pictograph) They predict the data set they can garner several boxes of conversation hearts. Students record their data using an Excel spreadsheet. They create a graph based...
Curated OER
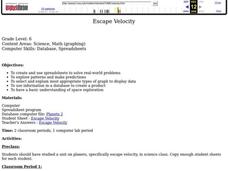
Escape Velocity
Sixth graders create/use spreadsheets to solve real-world problems, explore patterns, make predictions, select/explain most appropriate types of graph to display data, use information to create product, and have basic understanding of...
Curated OER
Chances Are......You're Right
Young mathematicians study probability. In this math lesson, learners calculate odds, and convert those into percentages of probability. Fractions are also used, making this lesson quite rich in some of the more difficult conversions...


