Hi, what do you want to do?
Annenberg Foundation
Geometry 3D Shapes: Euler's Theorem
How do you get a theorem named after you? Euler knows what it takes! The third lesson of five asks pupils to use an interactive activity to compare the faces, vertices, and edges of seven different three-dimensional solids. They use...
University of North Carolina
Statistics
Let's see you back it up! As shown in the 18th handout in the Writing the Paper series of 24 lessons from UNC, statistics help form an effective argument. The handout discusses how to analyze a source and break down the data to ensure it...
University of North Carolina
Evaluating Print Sources
Not all sources are created equal, so how do you evaluate them? Writers learn how to evaluate print sources based on elements such as audience, tone, and argument in the sixth handout of 24 in the Writing the Paper series from the...
University of North Carolina
Figures and Charts
Sometimes words aren't the best way to get information across to the reader. The eighth handout in the 24-part Writing the Paper series describes different type of figures and charts to display complex information in a paper....
PBS
Pbs Learning Media: Using Data Clusters to Find Hacker
The CyberSquad searches for Hacker's castle based on a survey of where town residents have last seen him in this video from Cyberchase.
US Census Bureau
Us Census Bureau: International Data Base
Statistical data on the population and demographics of 228 countries, including change, sex ratios, life expectancy, and percent with HIV/AIDS. There are also detailed explanations of the means of producing these statistics. It is...
University of North Carolina
University of North Carolina Writing Center Handouts: Statistics
When presenting an argument, the use of statistics to support a point can be very effective. This handout offers advice on both how to read statistics so that you understand exactly what they mean, and how to use them in your argument so...
Web Elements
Web Elements Periodic Table: Carbon
A very nice summary of key data on carbon, along with information of historical value and uses and applications of carbon compounds. Very helpful.
University of Illinois
University of Illinois: Rollin' Rollin' Rollin'
This resource is the beginning of a series of pages that demonstrates the diffference between the mean and median of a group of numbers. Uses bar graphs to display the data.
Other
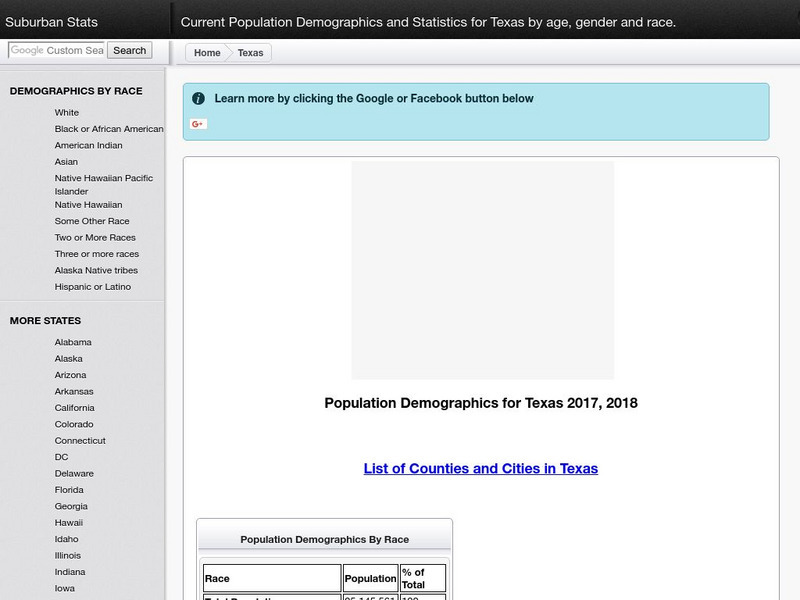
Suburban Stats: Current Population Demographics and Statistics for Texas
A collection of tables using US Census Bureau data showing the demographics for Texas in recent years. The population is broken down by race, age, gender, type of household, and duration of residency in one place.


