Hi, what do you want to do?
Grammarly
Grammarly Handbook: Visuals: Graphs, Charts, and Diagrams
This article explains that graphs, charts, and diagrams are used to display information visually. The choice of what type of graph or chart to use depends on the information to be displayed. Software programs make these much easier to...
Other
Delta State University: Lesson Plan 3: Pie Graphs
The students will gather, organize, and display data in an appropriate pie (circle) graph using M&M's! [PDF]
Better Lesson
Better Lesson: Circle Graph Activity
This lesson will allow the student to work through three stations. The stations will focus on creating and analyzing circle graphs. The students will be using technology to create their graphs along with a hands on activity using M &...
Council for Economic Education
Econ Ed Link: The Economics of Homebuying
This instructional activity analyzes the costs and benefits of homeownership and asks the student to describe the factors that affect affordability, use cost-benefit analysis and knowledge of home-buying procedures to reduce the costs,...
English Zone
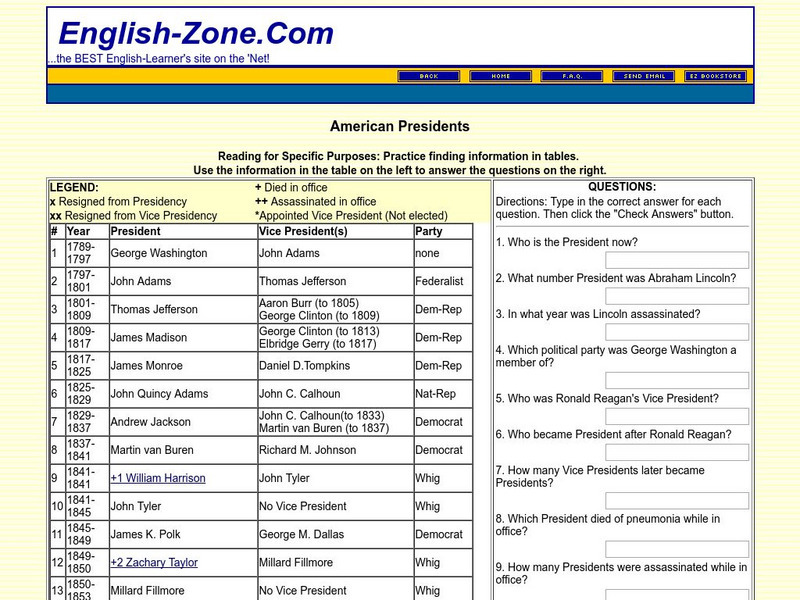
English Zone: American Presidents: Reading for a Specific Purpose
In this activity, information about American presidents is provided in chart format on the left and asks students to use the chart to answer the questions on the right. Note: the last president listed is George W. Bush. Java is required.


