Hi, what do you want to do?
Texas Education Agency
Texas Gateway: Evaluating Data in Tables, Graphs and Charts
[Accessible by TX Educators. Free Registration/Login Required] In this lesson students look at examples of graphics, tables, charts, and graphs, and learn how to interpret their data. They will be able to use this skill to enhance their...
E-learning for Kids
E Learning for Kids: Math: Group of Pyramids: Fractions and Graphs
On this interactive website, students practice various math skills using a real-life scenario at the pyramids. Those skills include showing percentages as fractions and decimals and interpreting data in a sector graph.
BBC
Bbc Skillswise: Graphs: Lists and Tables
Resource shows how to use lists and tables to organize information.
Colorado State University
Colorado State Writing Center: Charts
The use of charts and graphs can improve your presentations, whether on paper or as visual aids. Here you can read about how to create line, column, bar, pie graphs, and scatterplots. Just follow the links to their respective pages.
McGraw Hill
Glencoe: Self Check Quizzes 2 Circle Graphs
Use Glencoe's Math Course 2 randomly generated self-checking quiz to test your knowledge of circle graphs. Each question has a "Hint" link to help. Choose the correct answer for each problem. At the bottom of the page click the "Check...
Other
Nearpod: Graphing Equations Using a Table
For this lesson on graphing equations using a table, students will learn how to create a table for a function in terms of domain and range and then graph the function on the coordinate plane.
Other
Kim's Korner: Graphic Organizers for Writing and Reading
What are graphic organizers for reading and writing? Use this site to learn more about these learning tools.
ClassFlow
Class Flow: Using Graphs in History Class
[Free Registration/Login Required] This flipchart covers the major types of graphs used in social studies such as bar graphs, line graphs, pie graphs, and pictographs. Information on graphs is followed by graphs dealing with salaries...
City University of New York
Virtual Geology: Maps Home Page: Topic and Quiz Menus
This collection of resources cover map topics and includes quizzes for improving map and globe usage skills.
Primary Resources
Primary Resources: Line Graphs and Pie Charts
Here are a few resources to use with your students when teaching about line graphs or pie charts.
Math Is Fun
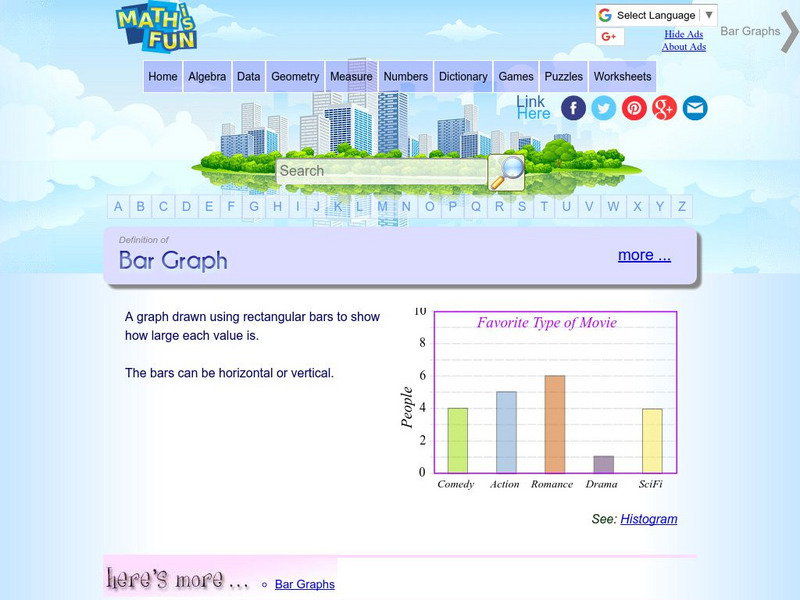
Math Is Fun: Definition of Bar Graph
Get the definition for a bar graph. Then, select the link "here's more" and use the interactive graph to display data as a bar graph, line graph or pie chart. The finished graph may be printed.
ClassFlow
Class Flow: Interpreting Tables and Graphs
[Free Registration/Login Required] Explore a variety of graphs and tables. Many activities are incorporated to provide practice solving problems using different graphs and charts.
TeachEngineering
Teach Engineering: Engineering for the Earth
Young students are introduced to the complex systems of the Earth through numerous lessons on its natural resources, processes, weather, climate and landforms. Key earth science topics include rocks, soils and minerals, water and natural...
Other
Hhs: Physical Activity Fundamental to Preventing Disease
Here, read statistics from the US Department of Health and Human Services concerning exercise and its key role in preventing chronic illness and premature death. Use these findings from medical studies in which diseases were studied in...
Other
Nmu: Box and Whisker Plot Instructions
Site discusses the use of box-and-whisker plots. An example is presented and completely worked through, so that the user can see the results of the calculations after the steps have been explained.
Science Education Resource Center at Carleton College
Serc: Minnehaha Falls: Observing Changes in Nature Through Drawing and Writing
Students will take a nature field trip to practice their observational skills and then communicate their findings through drawing, writing, and sharing.
PBS
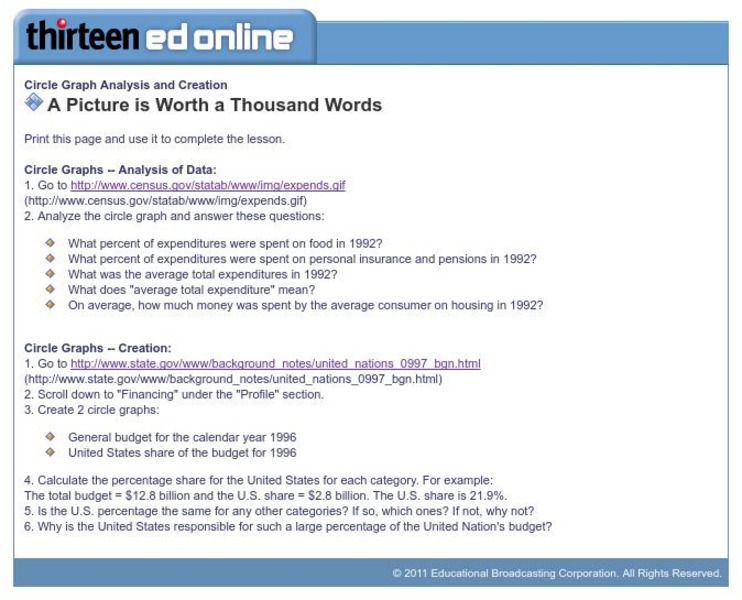
Wnet: Thirteen: Circle Graph Analysis and Creation
This site, which is provided for by WNET, gives a great way to practice using circle graphs through these exercises. One is analyzing a pie graph from the Census Bureau and the other creating pie charts using government data.
Harvard University
Harvard Smithsonian: Everyday Classroom Tools
The focus of this series of lessons is to engage students in an exploration of the world around them. The emphasis is on inquiry as students learn about the earth, sun, light, shapes and more.
Other
Carbon 14 Dating
Seven pages all about Carbon 14 Dating. Information on half-life, Carbon 14 used to date specimens and artifacts, limitations, charts and graphs. Michael E. Brown Ph.D. contests that the limitations of Carbon 14 dating support the theory...
University of Cambridge
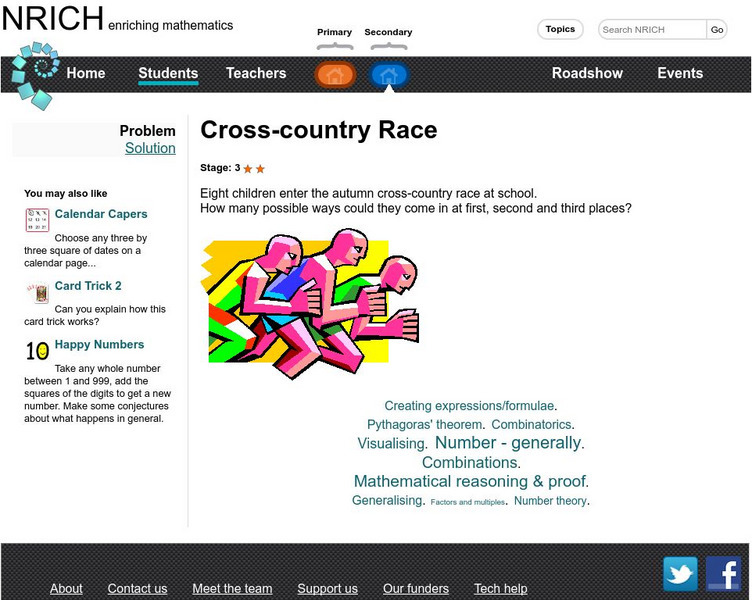
University of Cambridge: Nrich: Cross Country Race
On this one page website sharpen your logic and problem solving skills while working on this challenge. The solution is available to double check your solution.
Scholastic
Scholastic: Max's Math Adventures: A Hairy Situation
Help Max make a bar graph to show the hair colors of his classmates. Teachers will appreciate the activities with bar graphs in the extra challenges. Use the teacher's guide to create a fun and engaging lesson.
US Department of Energy
United States Department of Energy: Power Metering Project
Two part lesson plan focuses on applying analytic tools such as pie charts and bar graphs to gain a better understanding of practical energy use issues. Students will learn how different types of data collected affect the outcome of...
Other
Graphic Greats: Photo Treatment
This resource presents an article about the use of photos in documents.
University of Illinois
University of Illinois: Lesson on Linear Regression
This site from the University of Illinois gives lessons that explain linear regression in detail by using many charts and examples.


