Howard Hughes Medical Institute
Spreadsheet Tutorial 3: Column Graphs, Error Bars, and Standard Error of the Mean
There's absolutely no error in using the tutorial! Learners use spreadsheets to create column or bar graphs with error bars. They also learn how to calculate the standard error of the mean in the tutorial. This is the third installment...
Curated OER
Using Computer for Statistical Analysis
Students use the computer and S'COOL data for statistical analysis.
Curated OER
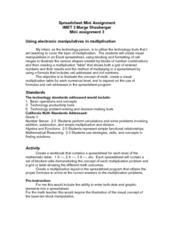
Using Electronic Manipulatives in Multiplication
Factor polynomials using electronic manipulatives. Your class will create a spreadsheet in excel and use it to multiply and perform basic operations and solve problems correctly. They create a visual to go along with each multiplication...
Me and My Shadow
Trace My Shadow
Which creates more digital traces: surfing the Internet in a coffee shop, or using an iPhone to send a text message? The answer may surprise you! An interactive resource prompts users to choose which devices, operating systems, and...
Curated OER
Calculator
Students explore the calculator utility function on a Macintosh computer. In this calculation lesson plan, students launch the calculator feature and complete a problem solving worksheet.
Curated OER
Interest Calculation and Spreadsheets
Students, while in the computer lab working on a spreadsheet program, calculate interest and accumulated value of a savings plan. They follow specific directives on how to create their spreadsheets. At the end of the lesson they print...
Curated OER
The Disappearing Kelp Forest
Learners observe the effect "El Nino" left on kelp plants and sea urchins. They analyze the data collected by researchers, by graphing it on a TI calculator. Before graphing and analyzing the data, you may want to revisit the events of...
Curated OER
Graphing Using Excel
Fifth graders complete a series of graphs by gathering information and using Excel to graph the information. In this graphing lesson, 5th graders graph favorite desserts of the class. Student put their results into the...
Film English
iDiots
Mobile phones have become an integral part of many people's lives. Examine the role and impact of technology through a short video and related activities. Pupils share what they use their phones for before viewing the film. Class...
Howard Hughes Medical Institute
Spreadsheet Tutorial 1: Formulae, Functions, and Averages
Spread your knowledge of spreadsheets. The first of five tutorials in the Spreadsheet Data Analysis unit introduces the basics of spreadsheets. It shows future data analysts how to organize and format tables, and how to use functions to...
Curated OER
Basic Excel
Students explore basic Excel spreadsheets. In this spreadsheet lesson plan, students enter Alaska weather information and perform calculations. Students title the columns on the spreadsheet and format the cells. ...
Curated OER
Mathematics: Technology and Connections
Sixth graders interpret and replicate patterns. For this patterns lesson, 6th graders are given an item with a definite pattern which they must replicate using a calculator or computer and then justify how they relate. Students...
Curated OER
The Internet Pizza Server - Pizza Simulation
Students simulate going to a pizza restaurant, ordering a pizza, and determining whether a small, medium, large, or family size pizza is a "better-buy." Students calculate the price/per/topping and determine whether this price is "fair"
Alabama Learning Exchange
Comparing Fuel Economy
Compute fuel economy and gas mileage. Why? So you can teach rates and ratios, of course! Middle schoolers calculate the rate of miles per gallon for various vehicles. They research each vehicle, its mileage per gallon, and cost per...
Howard Hughes Medical Institute
Spreadsheet Tutorial 4: t-Test
The t-test tutorial will fit your needs to a T. After calculating the mean, sum of squares, standard deviation, and variance of two data sets on a spreadsheet, scholars learn to calculate the t-values. They then learn to use the TTEST...
Howard Hughes Medical Institute
Spreadsheet Tutorial 2: Autofill Data, Cell References, and Standard Deviation
If you've always wanted to know more about spreadsheets, here's a perfect resource for you. A self-paced tutorial introduces how to autofill and copy formulas in a Google sheet or Excel spreadsheet. It also shows users how to find range,...
Curated OER
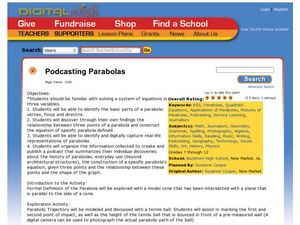
Podcasting Parabolas
Students explore parabolas. In this algebra and technology lesson, students construct the equation of a specific parabola, then take digital photos of real-life representations of these parabolas. Students create a podcast...
Curated OER
Conversions: Metrics Made Easy
Students convert standard units of measurement to metric units using tape measures, meter sticks, rulers, and online conversion calculators.
Curated OER
Calculating Profits from Selling Virtual Lemonade
Students set up and collect data for a virtual lemonade stand. In this entrepreneurship, economics, and technology lesson, students purchase ingredients, determine costs, and set up a virtual lemonade stand. Students consider weather...
Curated OER
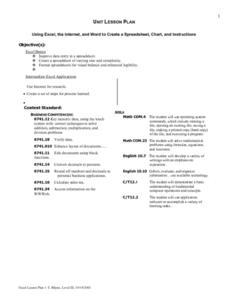
Using Excel, the Internet, And Word To Create a Spreadsheet, Chart, And Instructions
Learners improve data entry in a spreadsheet.
Curated OER
Numeracy
Students review numbers, number systems and the number operations through the use of online webpages.
Curated OER
Using Averages to Create Graphs Through Excel
Sixth graders create and use a spreadsheet to make graphs which will be used to analyze Progress Report and Final Report Card grades. They practice finding the mean, median, mode, and range of a data set. Students also incorporate column...
Curated OER
Using Computer for Statistical Analysis
Students examine the use for spreadsheets in analyzing data. They make spreadsheets that display and calculate a given data set such as temperature change.
Curated OER
Baseball Stats
Students explore data sheets and statistics in baseball. They use baseball data available on the Internet to develop an understanding of the different ways in which data can be analyzed.
Other popular searches
- Division Using a Calculator
- Math Using a Calculator
- Money Using a Calculator
- Graphing Using a Calculator
- Exponents Using Calculators
- Math Using Calculators
- Using a Calculator/an
- Practice Using Calculators


