Curated OER
Making a Bar Graph
In this bar graph worksheet, students analyze a data table and bar graph depicting information about stickers collected. Students answer 5 questions about the data displayed.
Curated OER
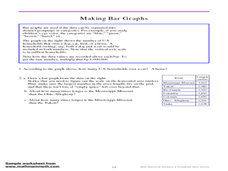
Making Bar Graphs
In this bar graph instructional activity, students answer short answer questions about bar graphs. Students answer 1 question about a bar graph about a cat, and 3 questions about a bar graph about U.S. rivers.
Curated OER
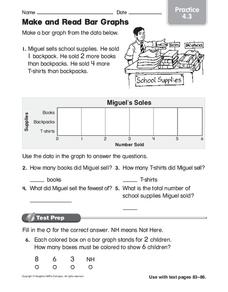
Make and Read Bar Graphs
For this bar graphs worksheet, students make a bar graph about the sale of school supplies with the data presented in one story problem.
Curated OER
Bar Graph Activity: Spelling Bee
In this bar graph worksheet, students use information about a class spelling bee, shown in a bar graph, to complete a set of 7 related questions. Answers included on page 2.
Curated OER
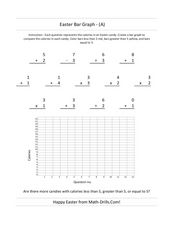
Easter Bar Graph- A
In this Easter math worksheet, students first solve 13 problems with addition, subtraction, multiplication and division. Using the answers, students make a bar graph.
Curated OER
Activity: Make a Bar Graph
In this bar graph worksheet, students use a given picture to create a graph, then use the graph to solve 2 related problems. Graph is sports related.
Curated OER
Horizontal Bar Graph-- Blank Grid
In this math worksheet, students use the blank horizontal bar graph to record and display any data and to learn the correct way to generate a bar graph. Spaces are marked for students to write in the title and labels; intervals of 1-10...
Curated OER
Double Bar Graphs
In this double bar graphs practice worksheet, students sharpen their problem solving skills as they solve 6 story problems.
Curated OER
Graphing Data
Seventh graders solve and graph 10 different problems that include various questions related to data on a graph. First, they create bar graphs to display the data given. Then, pupils determine the random sample of a population listing...
Curated OER
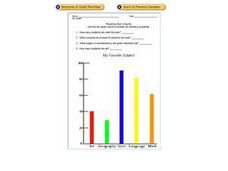
Reading Bar Graphs: My Favorite Subject
In this bar graphs worksheet, students analyze a bar graph about favorite school subjects. Students use the information on the graph to answer 7 questions.
Curated OER
Representing Data
Second and third graders answer questions based on data presented to them in graphs. They see how to interpret data from a bar graph, line graph, and a chart.
Curated OER
What's Data?
Students get the opportunity to investigate the concept of data collecting. They explore how to tally and read a bar graph. Vocabulary about data is also be included. At the end of the lesson, individual students collect data independently.
Curated OER
Curious Clouds
Second graders explore clouds. They read The Cloud Book by Tomie dePola. Students sort the cloud pictures into three categories. Students create a graph using the cloud pictures. They use Excel to create a bar graph.
Curated OER
Perplexing Puzzles
Elementary and middle schoolers explore scatter plots. In this graphing lesson, pupils work in small groups and use jigsaw puzzles to develop a scatter plot. Younger young scholars may develop a bar graph.
Curated OER
Rockin' Data
Fifth graders are given the questions, "What type of music would you suggest the manager place in front of the store?". Students collect data by talking with 20 adults and create a bar graph on the computer to present the data.
Curated OER
Classroom Supplies
Challenge young mathematicians to buy classroom supplies by staying within the means of a $1,000 budget. The mathematical activity provides learners with the opportunity to decide what items from the supply list would benefit a class of...
Curated OER
Step Into My Shoes
Students order their classmates from smallest to largest foot length. In this ordering their classmates from smallest to largest foot length lesson, students trace each of their classmates foot. Students read a story called,...
Curated OER
Charting and Graphing Sales
Students analyze and represent weekly sales figures using tables, bar graphs, and pie charts. They draw conclusions using bar graphs and pie charts. Students are told that each day at school they have the option of buying or bringing a...
Curated OER
Choosing the Best Graph
In this mathematics worksheet, 6th graders use a line graph to illustrate how a measure of data changes and explain their reasoning. Then they use a bar graph to compare pieces of data and a pictograph to compare data.
School Sparks
Christmas Worksheets for Santa's Little Helpers
Just because children aren't in the classroom over winter break, doesn't mean that learning has to stop. Intended as a resource for parents, this eBook provides Christmas-themed worksheets and activities that engage children in...
Curated OER
Bar Graph Questions
In this bar graph worksheet, students solve 10 problems in which information on a bar graph is used to calculate answers. This page is intended as an online activity, but may be completed with paper and pencil.
Curated OER
Blank Bar Graph -interval of 5
In this blank bar graph instructional activity, students use the grid to display data in a bar graph. The intervals labeled are counting by 5s, from 5 to 50.
Curated OER
Blank Bar Graph
For this math graphing worksheet, students use a blank bar graph grid to display data. The intervals are counting by 2, up to 14. There are no problems provided.
Virginia Department of Education
Graphs
Examine different types of graphs as a means for analyzing data. Math scholars identify the type of graph from a series of data displays and then develop questions to match each one. Then, given a scatter plot of height versus age...

