Curated OER
Are You Ready to Rock?
Second graders investigate rock samples using magnifying class. In this earth science instructional activity, 2nd graders identify the physical properties and describe them verbally with their partners. They compare their findings with...
Curated OER
Designing An Investigation
Students will design a scientific investigation. In this engineering design lesson plan, students will set up an investigation, collect data and form a conclusion about bridge design. They will use common household items to construct...
Curated OER
Historical Mathematicians Project
Students, in small groups, use the Internet and other traditional sources to research historically significant mathematicians, write a paper, and creatively present research in class.
Curated OER
Student Worksheet
How are bubbles made? A simple experiment involving the construction of bubbles is available in this lab worksheet. A fun activity prompts pairs of learners to use dish soap in order to make bubbles. They keep track of the size of the...
Curated OER
The Five Senses
Study various objects and help kindergarteners use their five senses to classify the objects. They are presented with various objects and then use their five senses to sort and classify the objects. Then they use a Visual Ranking Tool to...
Curated OER
Food Pyramid Power: Looking Back and Moving Forward
Students show their knowledge of properties of objects as it pertains to sorting and creating patterns. In this food pyramid power lesson, students show their ability to use whole numbers in different representations by appling...
Curated OER
The Write Stuff
Fourth graders share a previously written portfolio piece and the class guesses the genre. Students use tally marks to keep track of how many of each piece there are in class. Once the data collection is complete, 4th graders create a...
Curated OER
On Our Way to School
First graders create a class graph that illustrates how they get to school and interpret data from the graph. They complete an assessment worksheet independently and answer questions about the graph shown.
Curated OER
Displaying the Data
Students gather facts about their parent's families through the completion of parent interview forms. Using tally marks, the data gathered is counted, transferred to graphs and used to create family timelines.
Curated OER
Ratios
Fourth graders complete a taste test of different sandwiches, rate them, and then put them in a ratio graph. In this ratio lesson plan, 4th graders write what they learned about ratios after this activity.
Curated OER
What's The Teacher's Choice?
Fifth graders explore how to use data and display it using a chart or graph. They use food choices for categories and then gather the data and use the provided chart for display. In small groups students discuss the data and the results.
Curated OER
Data Shuffle
Young scholars find an advertisement or newspaper using charts or graphs. They create another graph using the same information in a different format. They write a comparison of the two graphs.
Curated OER
Eerie Indiana!
Eleventh graders research the population for ten cities in their state, in this example, Indiana, using census information. They design a spreadsheet using the data and create a bar graph with the data. They complete follow up questions.
Curated OER
Fossil Fuel and the Ticking Clock
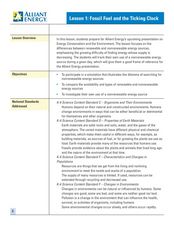
Students study energy sources to learn about fossil fuels and environmental concerns. In this energy sources lesson, students watch demonstrations for various energy examples. Students find hidden pennies, make a bar graph on their data,...
Curated OER
Active Learning
Students practice using measurements and bar graphs to solve a running problem in this active Math lesson for various age levels. The lesson meets state standards in Mathematics and requires the use of "math journals" for final...
Curated OER
Nicotine Why is it so hard to quit smoking?
Students interview both smokers and nonsmokers to get their point of view on the topic. They prepare bar graphs based on the data accumulated by the class during the interviews.
Center for Math and Science Education
Solar System Launch
Trying to understand the vastness of outer space can be quite a challenge for young scientists. Help put things in perspective with this cross-curricular activity as students work in pairs creating scaled models of...
Curated OER
Pick A Number
Elementary schoolers find out which month has the most class birthdays (mode) and which birthday represents the middle point of all the birthdays (median). They gather and organize data to find one number that fairly represents the whole...
Virginia Department of Education
Mathematics Vocabulary Cards - Grade 2
Augment your math curriculum with posters detailing several concepts important to second grade math. Each poster features one math term from geometry, measurement, probability and statistics, computation and estimation, numbers and...
Curated OER
Make a Frequency Table and a Histogram for a Given Set of Data
In this data recording and data organization worksheet, students create one frequency table and one histogram for a given list of data. Explanations and examples for frequency tables and histograms are given.
Curated OER
Do You Like to Spend or Save?
Students, after briefly discussing spending and saving habits, take a poll to see how their peers like to manage money. Then students graph their findings and discuss the survey results.
Curated OER
Driving Forces Forestry In Canada
Students discuss the natural and economic impact of forests and forestry. Using given statistics they construct different types of graphs in which they make observations and draw conclusions.
Curated OER
Best Guesser
Fifth graders develop strategies for estimating ages, and illustrate results by graphing and interpreting scatter plots to compare x and y coordinates.
Curated OER
Ladybugs in the Garden
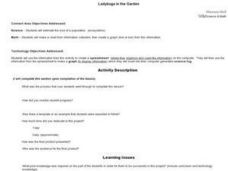
Fifth graders estimate the size a population (ecosystems) Students make a chart from information collected then create a graph (line or bar) from this information. Students do a lesson where they observed, examine, and record data...
