Curated OER
T-Shirt Lettering
Students determine the cost of a t-shirt using a variety of mathematical operations to solve problems. Then they use a spreadsheet to calculate the cost of lettering a t-shirt and display this information in a graph.
Curated OER
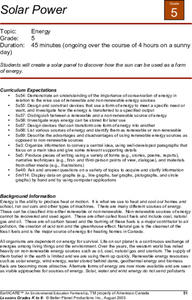
Solar Power
Fifth graders create their own solar panel. They use this experiment to see how the sun can be used as a form of energy.
Curated OER
The Solar Cycle
Learners research the solar cycle. In this Science lesson plan, students use the internet to investigate the solar cycle. Learners produce a spreadsheet and graph from the information collected.
Curated OER
Fire Safety Survey
Learners collect data regarding fire safety and create a graph. Working in small groups, they administer a survey to family and friends regarding their attitudes toward fire safety. After data has been gathered, students graph their...
Curated OER
After the Garbage Can: Where Does Our Trash Go?
Students explore how waste disposal has changed over time and what the current issues are. In this disposal lesson students collect data and create graphs.
Curated OER
Neighborhoods
Students examine homes around the world. In this multicultural lesson, students read the book A World of Homes and Homes Around the World. Students compare and contrast the homes in the books to their own homes. Students construct a...
Curated OER
Count On It!
Students investigate money. In this consumer math lesson, students use coins, identify their value, then group them in various ways to equal a dollar.
Curated OER
Where the Buffalo Roam
Students lear about energy, energy efficiency and consumption. They measure energy use, graph the date, write a letter then design and present a PowerPoint on the topic.
Curated OER
December Celebrations
Students study customs of various winter holidays. In this holiday lesson, students read the book The Reasons for the Seasons and complete a winter glyph. Students use graphing software to create a chart of the holidays that are celebrated.
Curated OER
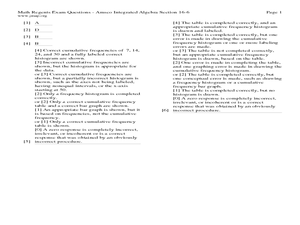
Quartiles, Percentiles, and Cumulative Frequency
In this statistics lesson, 11th graders are asked to calculate the percentiles, quartiles and cumulative frequency given different graphs and data. There are 6 questions with an answer key.
Curated OER
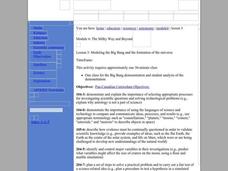
The Big Bang Theory
Learners will use scientific reasoning to formulate ideas about the formation of the universe using the Big Bang Theory. The use of critical thinking skills is part of the activity and the foundation of the scientific method will serve...
Curated OER
How Has Math Evolved?
Eighth graders pick a topic or person to research related to the history of mathematics. They brainstorm and create a concept map, using the multimedia software inspiration, about what they are researching and want to examine. They then...
Curated OER
My Car Has Potential
Seventh graders investigate how changes in the mass or height of a ramp can affect the change in potential energy. They discuss the concepts of work and energy, then using the four question strategy, they design an experiment that...
Curated OER
How Long? How Wide?
Second graders distinguish between and use nonstandard and standard units of measurement, use appropriate tools and techniques to measure length and width, and record and interpret data using graphs.
Curated OER
Population Pyramids
Young scholars work with and make population pyramids. In this population pyramid lesson, students use census data to make population pyramids for China, India, and the United States. They use the information to determine why jobs are...
Curated OER
Math Snack
Students practice math skills as they sort treats for snack. They prepare a table for snack. They count snack items. They complete a graph using the counted items.
Curated OER
Sports Data for the Classroom
In this algebra worksheet,students rewrite word problems using algebraic expressions. They collect data and plot their findings on the graph and analyze it. There is an answer key for this worksheet.
Curated OER
Crunching the Numbers on Dating Violence
Students read about potential violent relationships and beliefs about dating. In this relationship lesson students use graphs to examine data about healthy realtionshipsand draw conclusions on their results.
Curated OER
What Would Make Our School More "Green"?
Students survey their school to get ideas for how to make the school more environmentally friendly. In this environmental lesson, students collect data from other students and teachers. They use the data to create graphs and present a...
Curated OER
Touch and Discover
Students identify the physical properties of items using the sense of touch. In this touch and discover lesson, students describe items. Students sort items using a Venn diagram.
Curated OER
Jelly Bean Math
Young scholars estimate, measure, compute, and create patterns using jelly beans. In small groups, they solve various calculations, place jelly beans into groups, invent a new flavor, create a pattern, and complete a worksheet.
Curated OER
Caesar Ciphers: An Introduction to Cryptography
Students brainstorm and discuss the concept of cryptography, the science of secrets in today's world and then focus on a system for sending secret messages used by Julius Caesar. They make a Caesar wheel assessing encrypting and...
Curated OER
Moving Bodies
In this moving bodies worksheet, learners investigate how the amount of mass of a body in motion affects its tendency to remain in motion. Students use a meter stick as a ramp, marbles, string and a wooden block to determine how far a...
Curated OER
Lessons for Atlatl Users with Some Experience-Grade 5
Fifth graders throw darts, collecting data for distance traveled. For this data analysis lesson, 5th graders throw a dart using an atlatl. They calculate the speed for each throw and determine the best dart length for distance throws.
