Curated OER
I Wonder How Fast Manduca Grows...
Students create a graph showing the growth of their manduca since it hatched. They make their own predictions about how it will grow. They answer questions to end the lesson.
Curated OER
Ready for Roots
Fourth graders sort seeds and predict what conditions are needed for them to germinate. They keep the seeds moist, observe and measure their growth and graph the results. As the seeds start to grow students compare and contrast the each...
Curated OER
Seasons and Cloud Cover, Are They Related?
Students use NASA satellite data to see cloud cover over Africa. In this seasons lesson students access data and import it into Excel.
Curated OER
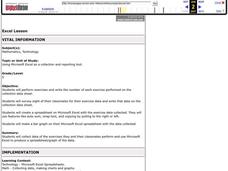
Excel Lesson
Fifth graders will perform exercises and write the number of each exercise performed on the collection data sheet. They survey eight of their classmates for their exercise data and write that data on the collection data sheet. They then...
Curated OER
Excel Lesson Plan Coin Statistics
Second graders determine the difference between making a prediction and determining actual information. They design a spreadsheet for a coin flipping activity on which they include their predictions and what actual happens when they flip...
Curated OER
Raisin the Statistical Roof
Use a box of raisins to help introduce the concept of data analysis. Learners collect, analyze and display their data using a variety of methods. The included worksheet takes them through a step-by-step analysis process and graphing.
Curated OER
Creating Climographs
Students chart statistical information on graphs, interpret the information and use it to explain spatial relationships, and identify the relationship between climate and vegetation.
Curated OER
A Fishy Tale
Eighth graders do a research project on a particular species of Atlantic seafood and record and graph information pertaining to commercial landings of that species of seafood. They use a website and an Appleworks spreadsheet.
Curated OER
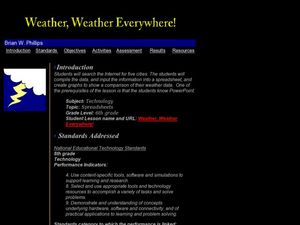
Weather, Weather, Everywhere!
Sixth graders collect weather data to compare temperatures around the world. Using the Internet, learners collect data, put it into spreadsheets, and analyze and graph the results. An interesting way to cover the topic of weather.
Curated OER
Data Analysis of Ground Level Ozone
Sixth graders construct and interpret graphs from ozone data collected in Phoenix area. Can be adapted to other areas.
Curated OER
School Yard Waste
Fourth graders examine the types of garbage that they collect on the playground. They collect the information in a spreadsheet and create a graph that displays the number of types of trash found. They design and monitor a playground...
Curated OER
How Big Is Your Head?
Students explore measurement by measuring classmates' heads. They record their measurements and they put the measurements in order from smallest to largest. Students figure the mean, median, mode, maximum, minimum, and range of their...
Curated OER
Highs and Lows
Plot data using the number line and discuss how negative numbers are used in math and science. Sixth and seventh graders share their graph with the class and provide an explanation for their plotting.
Curated OER
Mmm, Mmm, M&M's
Here is another version of the classic M&M math lesson. In this one, upper graders utilize the ClarisWorks Spreadsheet program in order to document the data they come up with from their bags of M&M's. After making their initial...
Curated OER
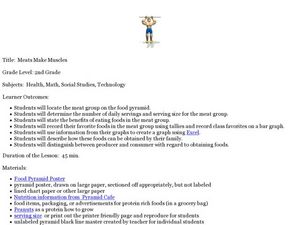
Meats Make Muscles
Second graders explore the meat group of the food pyramid. In this nutrition and diet lesson, 2nd graders study the benefits of eating foods in the meat group, collect data regarding their classmates' favorite foods, and create a graph...
Curated OER
Building Sets of 13 and 14
Compose and decompose sets of 13 and 14 and compare sets of each with your little learners. They use objects to construct sets of 13 and 14, record their answers, and compare sets in several different ways.
Curated OER
Water Wonders
Learners measure the amount of surface tension using a balance scale after a classroom demonstration students diagram the appearance of several liquids and label them.
Curated OER
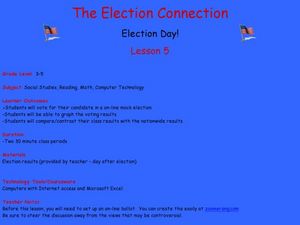
The Election Connection
Students participate in a mock election. In this election lesson plan, students vote online in a mock election, graph the results, and compare their results to the nationwide results.
Curated OER
Environmental Studies: The Power of Wind
Investigate the prospect of wind as a renewable resource. Second and third graders make a pinwheel, answer critical thinking questions, and then attempt to use wind power to wind string. I would be more apt to use this lesson in a 1st or...
Curated OER
Making Cents of Fractions and Decimals
Young scholars explore decimals and fractions using groups of 100 pennies. By classifying the pennies in different ways, there are an unlimited number of ways to learn fractions, decimals, and place value in money. This is a good,...
Curated OER
5th Grade Health Newsletter
Fifth graders choose health related topics of interest to them, research the topics employing a variety of resources, and then produce a newsletter using the technology available to them. The topics selected are also part of the 5th...
Curated OER
How Do You Get to School?
Third graders talk about all the various ways they get to school. They make a list of all the bus numbers that the students use. They also list all the other methods of transportation used and solidify a hypothesis.
Curated OER
Telling Time to 5 Minutes
In this second grade lesson plan your class will practice telling time. The goal is to tell time to five minutes using an analog clock. Your young students count by 5 minute intervals and discuss elapsed time.
Curated OER
Equivalent Fractions
If you are looking for a simple way to review equivalent fractions, this is a great resource. Using a visual means and a series of examples, learners review this skill. There is a worksheet provided and a prompt to encourage pupils to...


