Curated OER
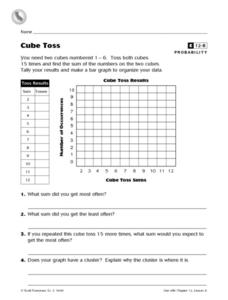
Cube Toss
In this probability and graphing worksheet, students solve 8 problems in which data from a cube toss is displayed on a table and graph. Students answer the questions about their results.
Curated OER
By Golly, By Gum
Students investigate the ingredients and creation of chewing gum. In this scientific method lesson, students make predictions about what will happen to the mass of a piece of gum as it is chewed by a human. Students graph the...
Curated OER
Building a Pill Bug Palace
Students make "pets" of isopods (potato bugs) to determine their preferred environment and food sources. They record their results on a bar graph and in a scientific report.
Curated OER
Finding Caterpillars
Students examine how animals protect themselves from predators and camouflage themselves. They participate in a simulation in which they locate red and green yarn "caterpillars," organize their data, and generate a bar graph using...
Curated OER
Lunchroom Trash
Students explore the amount of waste produced by humans. In this ecology instructional activity, students predict which lunch bag and its contents will produce the most waste. Leftover material is examined, amounts are recorded, and a...
Curated OER
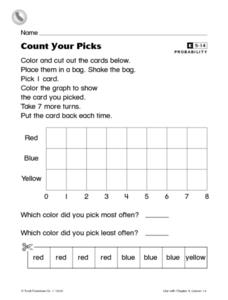
Count Your Picks
In this probability worksheet, students cut out 3 color cards and place them in a bag. Students pick a card out of the bag 8 times, putting the card back each time. Students record their results on a bar graph.
Curated OER
Mean, Median, and Mode 1
In this mean, median and mode worksheet, students use the measures of central tendency to describe given statistical data. Students identify the range of data, and match data to its representative bar graph. Two multi-step problems are...
Curated OER
Environmental Risk Analysis
Students complete a survey and enter the responses in a spreadsheet. The spread sheet is used to create a bar graph. Students complete spreadsheets listing types of hazards in their community.
Curated OER
Grid Paper
In this math worksheet, students create a bar graph using a ten by ten grid paper. Students can also create shapes using the grid paper.
Curated OER
Forest Management Dilemmas
Students discuss forest management dilemmas and make uninformed decisions as to whether they are appropriate management techniques. They draw bar graphs of the class opinion for each dilemma. They use media sources to become more...
Curated OER
Enhancing Writing Through Technology
Students participate in a class survey of their favorite activity to do in the snow and organize the results in a graph. They write a paragraph about the graph using language from a class-developed word web and include both an opening...
Curated OER
Opening the Case
Students participate in a class survey and then design an experiment and use graphs and statistics to assist them in solving a problem. They organize the results of the survey in a stem-and-leaf plot and find the range, median, mean, and...
Curated OER
Exploring Scale
Sixth graders discuss how the scale and type of graph can change how the data appears. With a partner, they identify all the information about the graph in a specific amount of time and record them in a journal. To end the lesson, they...
Curated OER
Other kinds of groups- part 4 of 5
Students compare and contrast characteristics of groups. Students create graphs using various symbols of different groups. Students make maps of their neighborhood 'groups'.
Curated OER
Algebra: Do You See What I See?
Students discover how to find the mean, median, and mode from sets of data. By using statistical techniques such as whisker plots and bar graphs, they display the data gleaned from problems. Individually, students complete projects...
Curated OER
Areology: The Study of Mars
Students use Oreo candy bars to explore how surface core samples call tell people about the history and make-up of Mars.
Curated OER
Dental Detectives
First graders explore the theme of dental health and hygeine. They make tooth loss predictions, count lost teeth, and graph tooth loss. In addition, they listen to dental health stories, read online stories, create spreadsheets, and play...
Noyce Foundation
Toy Trains
Scholars identify and continue the numerical pattern for the number of wheels on a train. Using the established pattern and its inverse, they determine whether a number of wheels is possible. Pupils finish...
Curated OER
Box It Up
Students use a six-step problem solving method to design a box/container. They are given the criteria for evaluation when presented with the problem. Students keep a notebook on processes, procedures, material, cost, design, machines,...
Concord Consortium
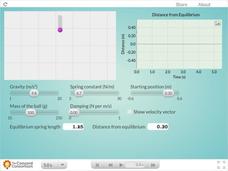
Spring and Mass
Here's a resource with more bounce for the ounce! Engage your physical science class with an interesting interactive that allows individuals to perform tests with a mass attached to a spring. Participants can customize the scenario by...
Concord Consortium
Breaking a Molecular Bond
Breaking up is hard, especially with a third part involved! Watch as molecules of hydrogen, oxygen, and nitrogen try to keep it together as a neutral third atom bombards them. Users control the reactive molecules and the velocity of the...
PreKinders
Transportation Word Cards
Beep beep! Zoom! Honk honk! Explore the world of transportation with a set of transportation picture word cards. Fifteen cards show trucks, planes, trains, boats, and many more types of transportation, complete with pictures and...
Law for Kids
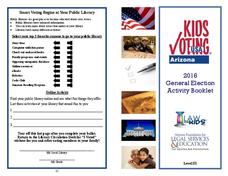
General Election Activity Booklet
It's never too early to practice smart voting! Gain practice voting in a general election using a booklet compiled of an assortment of activities including a word search, maze, graphing, and more!
Curated OER
Graphing With Second Graders
Second graders sort M & M's and then enter the data into a spreadsheet in order to create a simple graph. After printing the spreadsheet generated graph, have students compare the printed graph with their paper graph.
