Shodor Education Foundation
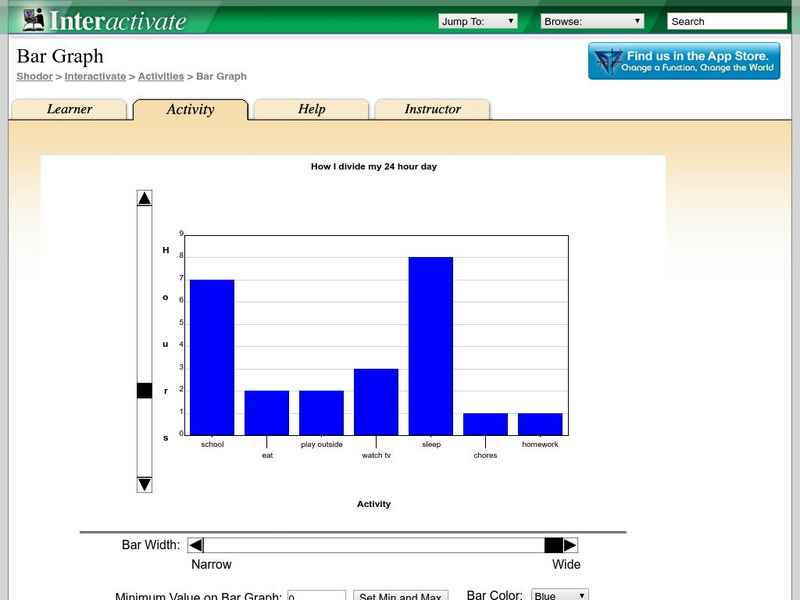
Shodor Interactivate: Bar Graph
A wonderful tool and learning experience using a bar grapher. This site contains an interactive bar grapher and much more! Follow the "What?" link to get to classroom resources such as problems and explorations.
Primary Resources
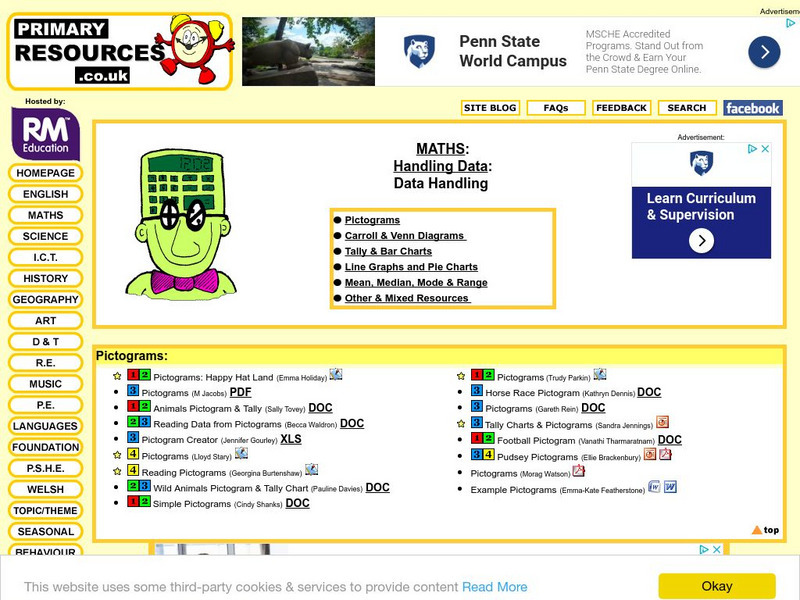
Primary Resources: Tally and Bar Charts
Lots of good materials for teaching about tally marks and bar graphs.
McGraw Hill
Glencoe: Self Check Quizzes 2 Using Bar Graphs and Histograms
Use Glencoe's Math Course 2 randomly generated self-checking quiz to test your knowledge of Bar Graphs and Histograms. Each question has a "Hint" link to help. Choose the correct answer for each problem. At the bottom of the page click...
PBS
Pbs Learning Media: Raising the Bar
Harry and Bianca's new boss at a concession stand uses bar graphs to keep records of their refreshment sales in this video from Cyberchase.
Khan Academy
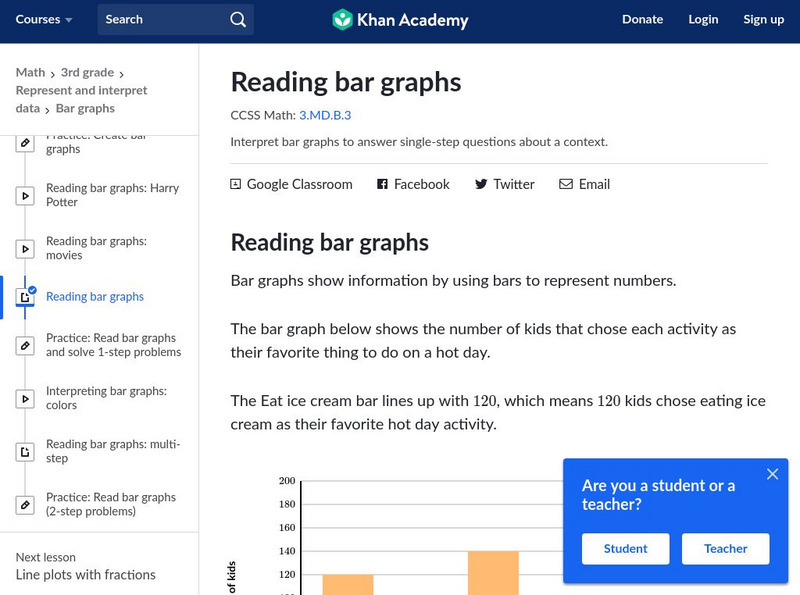
Khan Academy: Reading Bar Graphs
Explains what bar graphs are, their uses, and presents practice problems for creating a bar graph and answering questions about them. Problems are accompanied by detailed solutions.
Scholastic
Scholastic: Study Jams! Math: Data Analysis: Bar Graphs
Watch a short animated video explaining how to set up a bar graph to graph information. Then test yourself to check for understanding.
CK-12 Foundation
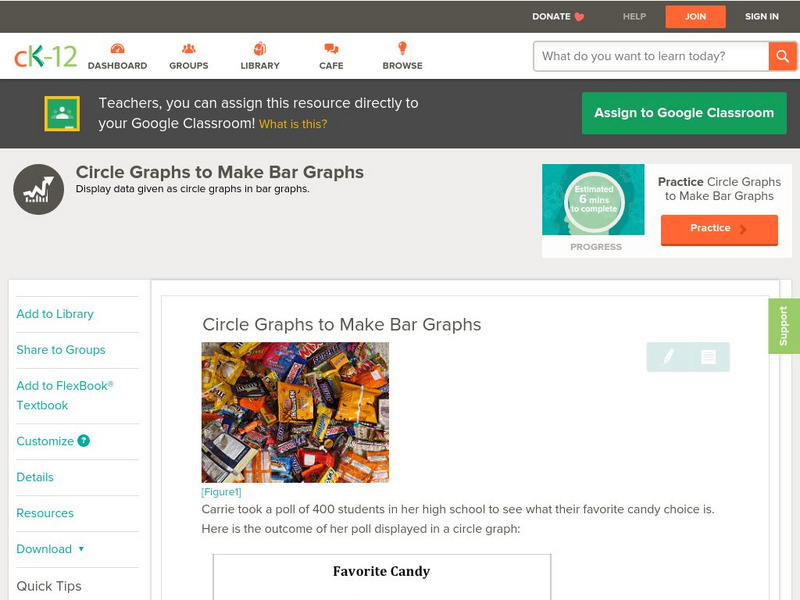
Ck 12: Statistics: Circle Graphs to Make Bar Graphs
[Free Registration/Login may be required to access all resource tools.] Create a bar graph using data displayed in a circle graph.
Khan Academy
Khan Academy: Make Bar Graphs 1
A practice quiz where students construct bar graphs using the given information. Includes hints.
University of Regina (Canada)
University of Regina: Math Central: Circle and Bar Graphs
Students evaluate data, use the data to make different types of graphs, and then investigate these graphs. Teacher's notes are included along with downloadable versions of the activity. This lesson is from a group of lessons that uses...
National Council of Teachers of Mathematics
The Math Forum: How to Make a Bar Graph
Site contains specific directions for making bar graphs using a Claris Works spreadsheet file.
Alabama Learning Exchange
Alex: Getting to Know Your Classmates Using Bar Graphs
Young scholars will collect data from class using surveys. Students survey classmates concerning favorite movies, favorite color, shoe size, time spent studying, brand of cell phone and etc. From the data they will create bar graphs...
ABCya
Ab Cya: Fuzz Bugs Graphing
Students drag the fuzz bugs into the correct container to create a bar graph that is used to compare data.
Mangahigh
Mangahigh: Data: Using Bar Charts
This site provides students practice with the concept of bar charts. Students can learn about the topic by completing an interactive tutorial. Students can then take a ten question timed test to practice the skill.
Texas Education Agency
Texas Gateway: Selecting and Using Representations for Collected Data
[Accessible by TX Educators. Free Registration/Login Required] Given a variety of data (including line plots, line graphs, stem and leaf plots, circle graphs, bar graphs, box and whisker plots, histograms, and Venn diagrams), the student...
ClassFlow
Class Flow: Ice Cream Bar Graph
[Free Registration/Login Required] This flipchart reviews bar graphs, how to create them and read them. Excellent activity to get your students involved in a tasty math activity!
Math Is Fun
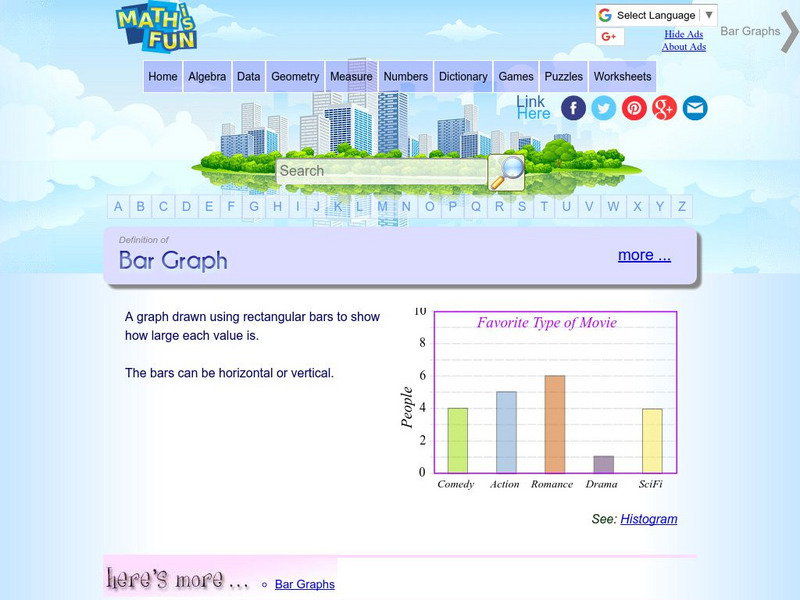
Math Is Fun: Definition of Bar Graph
Get the definition for a bar graph. Then, select the link "here's more" and use the interactive graph to display data as a bar graph, line graph or pie chart. The finished graph may be printed.
Khan Academy
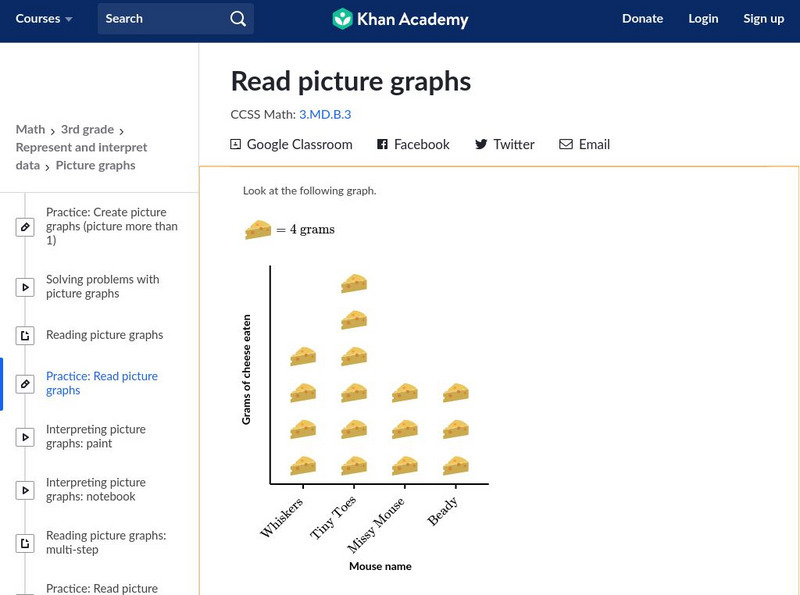
Khan Academy: Read Picture Graphs
Use picture graphs to solve word problems. Students receive immediate feedback and have the opportunity to try questions repeatedly, watch a video or receive hints. CCSS.Math.Content.3.MD.B.3 Draw a scaled picture graph and a scaled bar...
ArtsNow
Arts Now Learning: We Are Living Graphs and Data [Pdf]
In this lesson, 3rd graders use their own bodies to create bar graphs and do problems involving addition, subtraction, and more or less amounts. They then create their own graphs, incorporating the features of graphs that they have...
Better Lesson
Better Lesson: Graphing Meaningful Data
Learners use their timed test scores to create a bar graph that compares their progress in learning math facts.
University of Illinois
University of Illinois: Bar Graphs
Two bar graph examples are shown and explained at this website. You can learn what kind of data is best represented using a bar graph.
Science Education Resource Center at Carleton College
Serc: Investigating Osmosis Using Water and Gummy Bears
For this biology classroom lab, students investigate the affect of soaking a Gummy Bear in water. They collect measurements of height, width, and mass before and after the soaking of the candy overnight. Students calculate % change for...
E-learning for Kids
E Learning for Kids: Math: Music / Dance Performance: Data and Chance Experiments
On this interactive site students use the setting of a dance performance to predict all possible outcomes and make vertical and horizontal bar graphs.
Texas Instruments
Texas Instruments: Quick Stats With Quick Poll
It's so simple. Since Quick Poll gives a bar graph when a poll is taken, the teacher can use these graphs to do all kinds of neat statistical manipulations with the students.
CK-12 Foundation
Ck 12: Physical Science: Scientific Graphing
[Free Registration/Login may be required to access all resource tools.] Usefulness and types of graphs.
