EngageNY
Margin of Error When Estimating a Population Mean (part 2)
Don't leave your classes vulnerable in their calculations! Help them understand the importance of calculating a margin of error to represent the variability in their sample mean.
It's About Time
Oil and Gas Production
Would you consider a power failure a current event? This lesson uses multiple experiments, guided inquiry activities, and group discussions to cover the topics of oil and gas production. This is the seventh lesson in a series of eight.
Curated OER
Sexual Reproduction and Meiosis
In this biology worksheet, 9th graders create one chromosome using a red plasticine and another using blue plasticine. Then they illustrate different ways of crossing over, including double crossovers. Students also explain genetic...
Curated OER
Using SWMP Data
Students are introduced to the SWMP system which tracks short-and long-term changes in water. Using this data, they plot and interpret the data on a graph to determine how human activities are lowering the water quality. They also...
US Department of Commerce
Census in Counties - Describing and Comparing Histograms to Understand American Life
Use graphs to interpret life in 136 counties. Pupils analyze histograms and describe the shapes of the distributions of data collected from several counties on different aspects of life. Scholars make predictions on the difference in...
Curated OER
Virtual Field Trip
This hands-on resource has future trip planners analyze graphs of mileage, gasoline costs, and travel time on different routes. While this was originally designed for a problem-solving exercise using a Michigan map, it could be used as a...
Curated OER
What Is El Niño?
Students access information at remote sites using telecommunications, identify impacts by reviewing past El Ni??o events, make and use scale drawings, maps, and maps symbols to find locations and describe relationships.
Curated OER
Student Costs Data Table
Young scholars compare and contrast two routes selected for a virtual field trip. They create a data table of educational activities, lodging, and meal costs using Microsoft Excel software.
Curated OER
Mean and Standard Deviation
Get two activities with one instructional activity. The first instructional activity, is appropriate for grades 6-12 and takes about 20 minutes. It introduces the concept of measures of central tendency, primarily the mean, and discusses...
Illustrative Mathematics
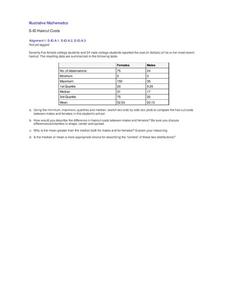
Haircut Costs
Who pays more for haircuts, men or women? Given quartile values, learners construct box and whiskers plots and interpret the results. They compare the mean and median, and discuss which is more appropriate under particular conditions....
Curated OER
Seeing Is Believing
Students investigate the concepts of probability. They use data to find the central tendency, median, and mode. Students design and play a game in order to practice the concepts. They also complete a table with data that is analyzed.
Illustrative Mathematics
Puppy Weights
Nobody can say no to puppies, so lets use them in math! Your learners will take puppy birth weights and organize them into different graphs. They can do a variety of different graphs and detail into the problem based on your classroom...
Curated OER
Pragmatics
Discover the differences in dialect when teaching linguistics. Many examples from Creole, Pidgin, slang, and the UK are used. The slides are black and white and mostly consist of various examples.
Curated OER
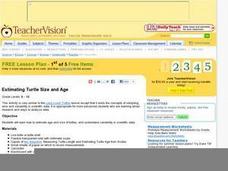
Estimating Turtle Size and Age
Young scholars investigate how to estimate the age and size of turtles, and examine variability in scientific data. They read an informational handout, identify the parts of the shell, measure the shell and estimate the age, and record...
Curated OER
Evolution
In this evolution worksheet, students review genetic variability, gene mutations, biodiversity and adaptations. This worksheet has 22 fill in the blank and 10 short answer questions.
Curated OER
Statistics with State Names
Students analyze the number of times each letter in the alphabet is used in the names of the states. For this statistics lesson, students create a stem and leaf plot, box and whisker plot and a histogram to analyze their data.
Curated OER
Illuminating Climate Change: Connecting Lighting and Global Warming
Students analyze energy usage and connect energy usage to fossil fuel consumption. In this global warming and pollution instructional activity, students what fuels are used to generate electricity and how much CO2 each fuel produces,...
Curated OER
Proteomics
Learners analyze data taken from proteomic experiments. In this biology lesson, students explain the importance of bioinformatics tools in the study of proteins. They evaluate scientific results using math and computer software.
Curated OER
How Oceans Affect Climate
Learners draw conclusions about how the ocean affects temperature. In this weather instructional activity, students use the Internet to gather data to help them come to a conclusion about how the climate in a certain region is directly...
Curated OER
Genetics
In this worksheet, students will answer 4 fill in the blank statements about Mendelian inheritance and meiosis. Then students will use Punnett squares to answer three short answer questions. Students will match 8 genetics vocabulary...
Curated OER
Introduction to Measurement
Students are able to observe and measure the variability in the length of the forearm and the length of the foot and to test a common belief of the foot is equal to the length of the forearm.
EngageNY
Displaying a Data Distribution
Pupils analyze a display of data and review dot plots to make general observations about the highest, lowest, common, and the center of the data. To finish, learners match dot plots to scenarios.
American Statistical Association
Bubble Trouble!
Which fluids make the best bubbles? Pupils experiment with multiple fluids to determine which allows for the largest bubbles before popping. They gather data, analyze it in multiple ways, and answer analysis questions proving they...
American Statistical Association
Armspans
Young mathematicians collect data on the arm spans of classmates. Then they sort the data by measures of center, spread, and standard deviation. Finally, they compare groups, such as boys and girls, to interpret any differences.


