Curated OER
Using Computers to Produce Spreadsheets and Bar Graphs
Students review graphing terminology and how to plot data points, how to input data into a spreadsheet, and how to make a chart using a computer.
Curated OER
Using Charts and Graphs to Study East Asia's Modern Economy
Students examine East Asia's modern economy. In groups, classmates use the internet to compare the resources, products, and economy of specified countries. After collecting the data, pupils create charts, tables and graphs. They...
Intel
What Does This Graph Tell You?
Learners choose natural phenomena to research. They design and conduct experiments or simulations. Students predict, gather, and analyze data. They graph the results using a spreadsheet software.
Curated OER
Graph Your Motion
Students graph their linear equations. In this algebra activity, students examine their lines and relate it to the slope or rate of change. They relate the steepness of the line to the slope being positive, negative or zero.
Fuel the Brain
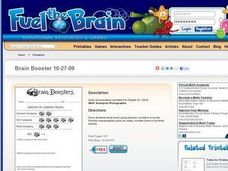
Interpret Pictographs
Have your youngsters use a graphic organizer and key to solve the following questions. By learning to interpret the pictographs, they will solve the problems accurately.
Curated OER
Graphing in the Information Age
Middle schoolers create a variety of graphs based on population data. In this statistics lesson, students use data that can be gathered on-line to make a bar chart, line graph, and circle graph.
Curated OER
Graphing Data Brings Understanding
Students collect, graph and analyze data. For this statistics lesson, students use circle, pie, bar and lines to represent data. They analyze the data and make predictions bases on the scatter plots created.
Curated OER
Temperature Bar Graph
Students explore mean, median and mode. In this math lesson, students analyze temperature data and figure the mean, median, and mode of the data. Students graph the data in a bar graph.
Curated OER
Reading Graphs
Students practice plotting functions on the Cartesian coordinate plane, see several categories of functions, including lines and parabolas, and read a graph, answering questions about the situation described by the graph
Curated OER
Color Tile Graphing
Students explore data. They gather data and generate questions about the data in pictographs, tallies, tables, and bar graphs. Students use color tiles pulled by random to create their own bar graph. They discuss the bar graphs they...
Curated OER
Graphs
Students investigate circle and bar graphs. In this middle school mathematics lesson, students determine which kind of graph is suitable for a given situation and create circle and bar graphs.
Curated OER
Histograms and Bar Graphs
Learners are introduced to histograms, bar graphs, and the concept of class interval. They use an activity and three discussions with supplemental exercises to help students explore how data can be graphically represented (and...
Curated OER
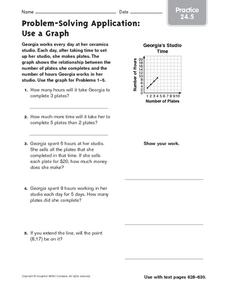
Problem-Solving Application: Use a Graph: Practice
In this graphing coordinates instructional activity, students study the graph and the coordinates. Students then answer the five questions about the graph and show their work.
Curated OER
Bar Charts and Pictographs: How can they help us?
First graders work with manipulatives to solve various math problems by using concrete objects to solve a list of problems . They create and evaluate bar graphs and write a statement about the information on their bar graph.
Curated OER
Using Data
In this analyzing data worksheet, 4th graders read, study and interpret a bar graph on how many hours Millie spends a week drawing each day. Students answer 2 short answer questions relating to the bar graph.
Curated OER
Use Graphs
In this math graphs worksheet, students use the talent show graph to help them find the answer for the problems. Students write number sentences for the last four problems.
Curated OER
Analyzing Non-Fiction Text Features- Graphs
Students examine the text features of non-fiction. For this literacy lesson, students practice reading graphs and discover the authors intent for using them in primary and secondary sources.
Curated OER
Analyzing Nonfiction Text Features - Graphs
Students examine the text features of non-fiction. In this literacy instructional activity, students practice reading graphs and discover the authors intent for using them in primary and secondary sources.
Curated OER
Baseball Relationships - Using Scatter Plots
Students use graphing calculators to create scatter plots of given baseball data. They also determine percentages and ratios, slope, y-intercepts, etc. all using baseball data and statistics.
Curated OER
Box and Whiskers
Middle schoolers discover how to relate collected data with a box and whiskers graph in a number of formats. They collect, organize, create, and interpret a box and whiskers graph. Pupils interpret the difference between sets of data,...
Curated OER
What's Data?
Students get the opportunity to investigate the concept of data collecting. They explore how to tally and read a bar graph. Vocabulary about data is also be included. At the end of the lesson, individual students collect data independently.
Curated OER
Interpreting Data from Birdfeeders
What kinds of birds live in your area? Read a book about birds to your learners and explore their feeding patterns. Charts and graphs are provided in this three page packet, but consider assigning the basic questions if using with young...
Curated OER
The Gathering and Analysis of Data
Young mathematicians gather data on a topic, graph it in various forms, interpret the information, and write a summary of the data. They present their data and graphs to the class.


