Illustrative Mathematics
Combined Fuel Efficiency
Practice simplifying complex fractions and long division of polynomials with this brief exercise. These four questions make a challenging warm-up activity or a short, but comprehensive, follow-up after a detailed lesson on algebraic...
Curated OER
Real Life Application of Area and Perimeter
Fifth graders explore real-life situations of area and perimeter. They develop a list of real-life applications of area and perimeter, select a situation, and write a step-by-step procedure and diagram on graph paper for solving the...
Curated OER
Shape Matters More!
Students investigate shapes as the area changes while the perimeter remains the same. Students demonstrate the shape/perimeter/area relationship using simulations and physical models.
Curated OER
Science: Reading a Compass
Students demonstrate how to take bearings using a compass. In pairs, they select objects in the classroom then write down its first initial and bearing. They exchange papers and try to disciver their partner's object.
Curated OER
Life Expectancy at Birth
Learners create a line graph on the life expectancy for males and females in Canada. In this math and health lesson plan, students review table and graph terminology, create line graphs, and analyze the differences in life expectancy...
Curated OER
Time Trials
Pupils investigate speed, time and distance. In this algebra lesson, students utilize their knowledge of linear equations to solve problems related to time, speed and distance. This assignment is hands on using two toy race cars.
Curated OER
Pythagorean Theorem
Students investigate the Pythagorean Theorem. In this seventh through twelfth grade geometery lesson, students explore the Pythagorean Theorem and its converse and use it to find the length of the missing side of a right triangle.
Curated OER
A Statistical Look at Jewish History
Students complete their examination over the Jewish Diaspora. Using population figures, they discover the importance of percentages in exploring trends. They use their own ethnic group and determine how it is represented in the United...
Curated OER
Perimeter and Area
Fifth graders identify the area and perimeter of a rectangle. In this perimeter lesson, 5th graders use geoboards and rubber bands to construct various rectangles. Students use the formula to calculate area and perimeter of the...
Curated OER
By Golly, By Gum
Students investigate the ingredients and creation of chewing gum. In this scientific method lesson, students make predictions about what will happen to the mass of a piece of gum as it is chewed by a human. Students graph the data from...
Curated OER
Fractions
Fourth graders explore fractions. They use Skittles and M&M's to practice adding and subtracting fractions. Students review the numerator and the denominator of fractions. They count the number of each color of Skittles and M&M's...
Curated OER
Scale Drawings
Middle schoolers discuss the importance of scaling drawings. In this math lesson, students create a scaled drawing of circuit boards. They explain why accuracy is very important when scaling.
Curated OER
Stem-and- Leaf Plots
Students are introduce to the notion of stem-and-leaf plots. They use stem-and-leaf plots to calculate the mean, median, and mode of a set of data. Students use computers to learn about stem-and-leaf plots.
Curated OER
What Pie?
Students practice making and interpreting pie graphs so they are better able to decide if a pie chart is the appropriate form of display. Students examine included overheads of different pie charts, and directions on how to make pie...
Curated OER
Finding the Area & Volume of Buildings Using Architectural Drawings
Fifth graders find the area and volume of buildings. In this architecture lesson, 5th graders look at the drawings of three historic Tennessee buildings. They use these to help find the area and volume of the building.
Curated OER
Shut it Off!
Students identify the central tendencies. In this statistics lesson, students find the mean, median and mode of their collected data. They explain the effect of outliers on the data.
Curated OER
Tallies Tell It All
Students explore data collection through the use of tally marks. After a demonstration of the use of tally marks students complete various inquires where they create a chart documenting the number of times a desired result happens. They...
Curated OER
Knowing North: Understanding the Relationship Between Time and The Sun
Students determine how to find North using a watch and their shadow. In this finding North lesson, students go outside on a sunny day and work with their shadow and a wrist watch to find out which direction that North is. They examine...
Curated OER
What are the Odds
Students predict the-outcome of an event. In this algebra lesson plan, students compare and contrast the probability of an event occurring. They calculate the odds of a simple event and make estimation.
Curated OER
Rent and owner's major payments
Students retrieve and map census data to determine the average rent and owners' payments made throughout Canada. They find out how many people are spending more than 30 percent of their income on housing.
Curated OER
The Dog Days of Data
Students practice an alternative form of data presentation. They practice sequencing data, identifying the stem-and-leaf, creating stem-and-leaf plots, and drawing inferences from the data by viewing the plots.
Curated OER
The Dog Days of Data
Students are introduced to the organization of data This lesson is designed using stem and leaf plots. After gather data, they create a visual representation of their data through the use of a stem and leaf plot. Students
drawing...
Curated OER
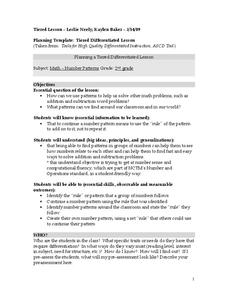
Number Patterns
Second graders identify number patterns. In this number lesson, 2nd graders find the rule or pattern in a group of numbers and continue the pattern using the rule. They create their own number pattern by making their own rule.


