Curated OER
A Look at the Population Density of the United States
Students acquire census information and create maps of the population density of the United States on different scales. They role play the roles of workers of a retail company and they use the population data to market to their customers.
Curated OER
Mapping Districts
Learners become literate in their use of maps. In this 2010 Census lesson plan, students visualize census data on maps, use map keys to read population maps, and explore the concept of population density.
Curated OER
Mapping Districts
Students use maps to learn about the U.S. Census. In this 2010 Census lesson plan, students visualize census data on maps, use map keys to read population maps, and explore the concept of population density.
Curated OER
Farm Census
Students disuss the work of a farmer. They recognize and name farm animals to represent the information in a pictogram.
Curated OER
What's the Point?
Students learn why the census makes a difference. For this U.S. Census lesson plan, students identify who uses census data and how, trace the impact of census data from Census 2000, and present findings in a graphic format.
Curated OER
Numbers Tell a Story
High schoolers connect census data to historical events. For this civics lesson plan, students understand cause and effect, and how they are reflected in census data and analyze census data for social and economic significance.
Curated OER
Analyzing the Job Market for Babysitting in Your Neighborhood
Students conduct research on a neighborhood in Canada. In this data analysis instructional activity, students use data from the 2006 Canadian census to draw conclusions about a population group.
Smithsonian Institution
Changing Gender Roles on the Home Front
Many historians discuss how gender roles changed because of World War II, but how did this come to be? An informative resource challenges scholars to do some digging and research the information for themselves. They research how...
Curated OER
Censusmania
Students understand how the census can reveal information about people and history. They create their own census.
Curated OER
Exploring Racial and Ethnic Diversity
Pupils explore and examine racial and ethinic diversity in the metropolitan areas of the United States. They examine data from the US Census Description of Race and Ethnic Categories. Students explore the population by race and ethnicity...
Curated OER
Size It Up: Map Skills
Compare information from a US population cartogram and a standard US map. Learners draw conclusions about population density by analyzing census data a population distribution. They discover that census data is used to apportion seats in...
Curated OER
Teenage pregnancy trends in Canada
Students analyze demographic data relating to teen pregnancy trends. They develop skills to locate and interpret data. They discuss the factors that influence teenage pregancy such as social, economic, and educational issues.
Curated OER
Statistics Canada
Learners practice using graphing tools to make tables, bar charts, scatter graphs, and histograms, using census data. They apply the concept of measures of central tendency, examine the effects of outliers. They also write inferences and...
Curated OER
Reading Primary Source Documents: Historical Content
Why do we read primary source documents? What can they give us that other writings cannot? Provide your learners with any of the primary sources attached here (there are seven), and have them complete the graphic organizer (which opens...
Curated OER
Committing to Respect: Lessons for Students to Address Bias
Here's a guide designed to build safe, respectful learning environments, and to build understanding of the value of diversity through lessons packed with activities for specific grade levels.
Curated OER
Mapping the changes in Canada's population
Learners find and analyze data found in the census. They compare the population from 1996 to 2001. They explore the type of data they can find in the Census of Population.
Curated OER
Distribution of children living at home
Students examine census data to evaluate the number of students of certain ages living at home. This data is then used to determine the need for day care, or other social programs. They use this information to explore social policies.
Curated OER
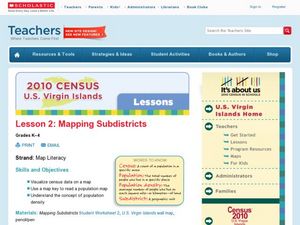
Lesson 2: Mapping Sub-districts
Students learn more about the census. In this mapping sub-districts lesson plan, students visualize census data on a map, use a map key to read a population map, and better understand the concept of population density.
Curated OER
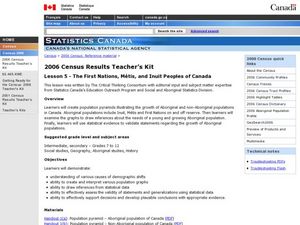
The First Nations, Métis, and Inuit Peoples of Canada
Young scholars explore demographic shifts. In this Canadian Census lesson plan, students interpret data from the 2006 Census to determine the needs of the Aboriginal population in the country.
Curated OER
Race and Ethnicity in the United States
Students explore race and ethnicity as it is defined by the U. S. Census Bureau. They compare data from 1900, 1950, and 2000 and identify settlement patterns and changes in population. In groups, they map these changes and discuss...
Curated OER
Census Data and New Hampshire History
Young scholars graph the population growth of New Hampshire using historical census data.
Curated OER
Count On Us: Concepts and Applications of Demography
Eighth graders use the Internet to research demographics of certain areas. They use the U.S. Census Bureau's website to help them gather information. They use their data to find a solution to a hypothetical problem.
Curated OER
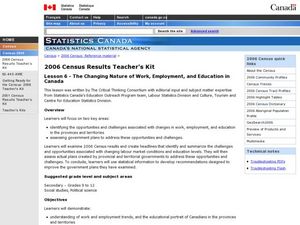
The Changing Nature of Work, Employment, and Education in Canada.
Students identify the effect caused by change of employment and education. In this statistics instructional activity, students analyze data and draw conclusions. This assignment tests students' ability to use data correctly.
Other popular searches
- Us Census Bureau
- Us Census Activity
- 2010 Us Census
- Us Census Graphing
- Us Census Native American
- Government Us Census
- Linear Regression Us Census
- Analyzing Us Census Data
- Us Census African Americans
- Us Census Worksheets
- Us Census Lesson Plans
- History of the Us Census


