Hi, what do you want to do?
Curated OER
New Food Saves Lives, Could End Hunger
Young scholars locate the country of Niger, then read a news article about a new type of food that is being used to fight childhood hunger in Africa. In this current events lesson, the teacher introduces the article with map and...
Curated OER
The Five Life Zone Research Project
Students study five of the seven life zones in North America. In this journalism lesson students use the Scientific Method working in teams. They use lab equipment and technology to create a presentation on five of the seven life zones...
Curated OER
SC Populations Along Major Interstates
Students examine the population among the interstates in South Carolina. Using the internet, they identify the counties and roads and compare it with their own drawing.
Curated OER
Cabeza de Vaca Meets the Coahuiltecans
Learners examine the difference between primary and secondary sources by examining the journal of Cabeza de Vaca and creating a poster about the Coahuitecan Indian groups. They portray a scene of the groups in 16th Century south Texas.
Curated OER
A Picture Is Worth A Thousand Words
Students complete a population pyramid for a city they are studying. They may complete a population pyramid for their city and another one for the country in which the city is located. They compare and contrast the results of the two...
Curated OER
Five Themes of Geography
Students conduct research to determine why geography is important and how it provides information regarding many aspects of the world. They investigate the hemispheres, longitude, latitude and absolute location.
Curated OER
How Old Is A Tree?
Students examine new concepts related to the aging of a tree. They use the rings on the stump to gather more information about the tree. They answer questions to complete the lesson.
Curated OER
How to Celebrate the 800th Anniversary of the Mogol Empire
Students research information on the Mongolian Empire from various readings and online videos of primary sources and create a poster for oral presentation. Students connect history with the current day, while incorporating geographical,...
Curated OER
Temperature Graphing
Fifth graders analyze temperature variations throughout the world by using computer graphing of select major national and international cities.
Curated OER
Temperature Graphing
Students analyze temperature variations throughout the world by using computer graphing of select major national and international cities. After analyzing their findings, students write a paragraph explaining their data.
Curated OER
Tooling Around Arizona: Reading Arizona Maps
Students study geography. In this Arizona maps lesson, students develop their map reading skills. They have class discussions and work independently with various copies of Arizona maps to practice those skills. This lesson mentions...
Curated OER
Who Were the First Americans?
Second graders explore Native Americans through a PowerPoint presentation.
Curated OER
Gainging Perspective
Seventh graders examine and evaluate different perspectives of human and wolf interactions. They develop a conclusion based on research through the use of electronic resources.
Curated OER
Farming in a Fishbowl: How Ethnic Groups in
Seventh graders research Chinese agricultural needs and practices. They conduct an experiment with aquaculture and germinated rice as they take measurements and apply the scientific method.
Curated OER
History of Colorado-Migration to the West
Fourth graders identify reasons for people moving to the Colorado Territory and examine how moving in the 1800's is different than moving today. They also practice reading maps and gathering information from maps, as well as, describe...
Other
United States Global Change Research Program
This government program integrates federal research on global climate change. Agency offers many resources regarding global as well as American climate change. For example, click on the section of the country where you live. Key issues,...
Other
Earth Journalism Network: Climate Commons
A unique interactive tool that embeds news articles and information about climate change into a map of the United States. Users are able to explore what the impact of climate change at a local, regional or national level, as well as...
NOAA
Noaa: Cpc: Regional Climate Maps
Provides large colorful maps of climate data about each continent for the current week, month, or previous quarter.
Science Education Resource Center at Carleton College
Serc: Studying Eco Climatic Domains
After learning about the climates of different ecological regions of the United States, students investigate the impact of climate change on plants that live in those regions. By looking at changes over time, they can better understand...
ClassFlow
Class Flow: The Southeastern Region of the United States
[Free Registration/Login Required] Exciting movies bring alive our Southeastern United States region, covering the economy, history, climate (to include hurricanes), and geography. Formative assessment allows the students success....
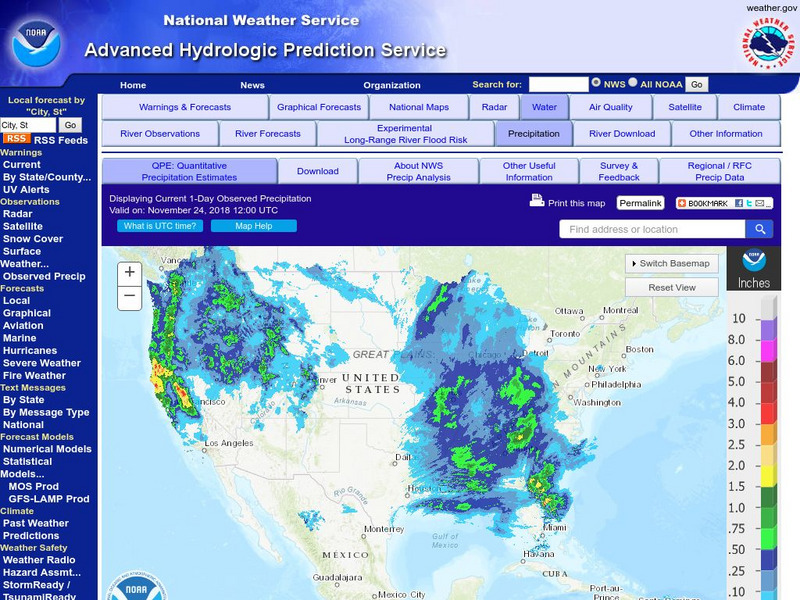
National Weather Service
National Weather Service:climate Prediction Center: Daily Precipitation Analysis
Find real-time daily precipitation analysis for the United States, Mexico, and South America as well as accumulated precipitation maps for the past 30 or 90 days.
Thinkport Education
Thinkport: Made Clear: What Is Mid Atlantic Climate Change?
Climate change is impacting every nation and continent on Earth- including the Mid-Atlantic region of the United States. Find out how.
Discovery Education
Discovery Education: Around the World
This resource will compare different regions of the world by climate, geography, animal life, and culture. The site focuses on the differences within the United States regions.


