Curated OER
Fun With Calendars
Students use four numbers to find calendar dates that form square numbers. For this square numbers lesson, students use algebraic equations to calculate and locate number patterns using a monthly calendar.
Curated OER
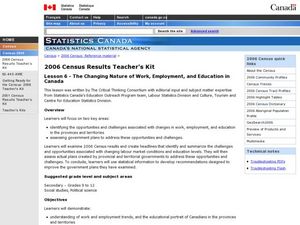
The Changing Nature of Work, Employment, and Education in Canada.
Students identify the effect caused by change of employment and education. In this statistics lesson plan, students analyze data and draw conclusions. This assignment tests students' ability to use data correctly.
Curated OER
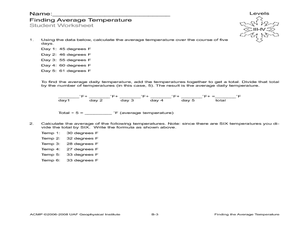
Finding the Average Temperature
Students calculate averages. In this average temperature lesson, students collect data and use their problem solving skills to calculate average temperatures.
Curated OER
Patterns In Hexagon Tables
Sixth graders construct a rule about the number of sides found in a pattern of hexagons. In this mathematical problem solving activity, 6th graders observe different hexagon patterns and create a rule about the relationship between the...
Curated OER
Tessellations in Excel
Students complete an Excel project on tessellations. In this technology and math lesson, students discuss tessellations and their occurrences in nature. Students use the Excel computer program to create tessellations.
Curated OER
MOBILITY, Bike Rack Remix
Students examine how riding a bike can impact the environment and cut down on carbon emissions. In this environmental lesson students design a bike rack that is made from recycled material.
Curated OER
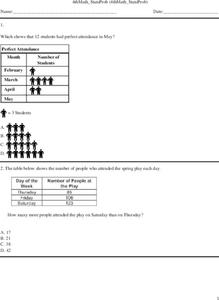
Math for Fourth Grade: Statistical Charts
In this math for fourth grade statistical charts worksheet, 4th graders answer 7 multiple choice questions in standardized test format about data, charts and graphs.
Curated OER
Fourth Grade Math Practice-Statistics
In this 4th grade statistics instructional activity, students complete a total of 7 problems. An answer key is provided; problems are related to statistics.
Curated OER
Gender and Income
Students investigate Income and gender preference. For this statistic lesson, students collect data of Income to see if one gender makes more than the other. Students examine the data and draw conclusions.
Curated OER
Basic Budgeting
Learners create a personal budget. In this creating a personal budget lesson, students create a list of 3 necessary things they need to survive. Learners rank these things in order of importance and determine their cost. Students...
Curated OER
Pictures of Data
In this data worksheet, students look at maps and charts and answer multiple choice questions about them. Students complete 10 questions.
Curated OER
Pictures of Data: Post Test
In this data worksheet, learners answer multiple choice questions about charts and graphs. Students answer 10 questions total.
Curated OER
Among the Hidden - Population Math Activity
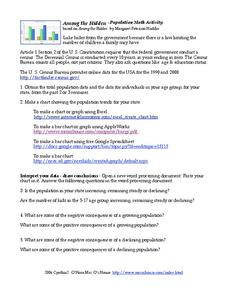
In this population worksheet, students collect data on population by researching the Census Bureau and then make online graphs and answer short answer questions about the data. Students complete 5 problems total.
Curated OER
Precalculus: Unit 3 Test 2
In this Pre-calculus instructional activity, students solve advanced logarithmic and exponential equations. The seven page instructional activity contains thirty-two problems. Answers are not provided.
Curated OER
Graphing Data Brings Understanding
Learners collect, graph and analyze data. In this statistics lesson plan, students use circle, pie, bar and lines to represent data. They analyze the data and make predictions bases on the scatter plots created.
Curated OER
How Do They Relate? Linear Relationship
Students collect information and use a line to represent it. In this algebra lesson, students investigate real world data to see if it makes a line. They graph the line comparing the relationship of the x axis with that of the y axis.
Curated OER
Line of Best Fit
Students identify the line of best fit. In this statistics lesson, students collect and analyze data. They calculate the regression equations and identify the different types of correlation.
Curated OER
Exploring Quadratic Graphs
Students solve quadratic equations using graphs. In this algebra lesson plan, students factor quadratic equations and graph their answer. They discuss the shape of their graph based on the function.
Curated OER
Top Ten Summer Lesson Plans: Make the Kick Off to Summer Fun!
The right summer lesson plans can help both teachers and students spend the final days of school in a fun and productive way.
Curated OER
Olympic records through time
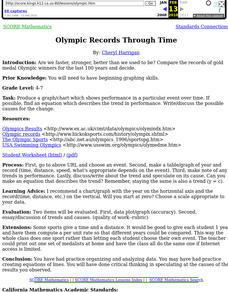
Young scholars compare the records of gold medal Olympic winners for the last 100 years and decide if we are faster, stronger than in the past.
Curated OER
Explain the Change
Twelfth graders complete research relating to population changes in counties/states in the U.S. from 1900 to 2000 and use the slope formula to determine the overall change in population for each of the ten decades. They present their...
Curated OER
An Apple A Day
Students create a graph that showcases their pick for favorite kind of apple. Students are given samples of a variety of apples to determine their favorite in a taste test. They a create a tally chart of favorite kinds apples and use a...
Curated OER
Good Weather
In this graphing data worksheet, students complete a temperature chart and then answer two questions about the weather for that week.
Other popular searches
- Periodic Table Trends
- Periodic Trends
- Fashion Trends
- Employment Trends
- Cultural Trends
- The Periodic Table Trends
- Health Trends
- Popular Trends
- Food Trends in the Uk
- Economic Trends
- Long Term Trends
- Population Trends


