Hi, what do you want to do?
Other
Ordnance Survey: Map Zone: Relief and Contour Lines
Discover how to read and show height on maps using relief and contour lines.
US Geological Survey
United States Geological Survey: Topographic Maps
"Note: The information on this page is being retained for technical and historical reference only. The site is not under active maintenance and may include expired information and outdated links." This site gives an overview of the...
University of Texas at Austin
Ut Library: Perry Castaneda Maps of New York
A collection of maps of the state of New York, including links to city maps, historical city maps, and maps of National Parks, Monuments, and historical places.
University of Texas at Austin
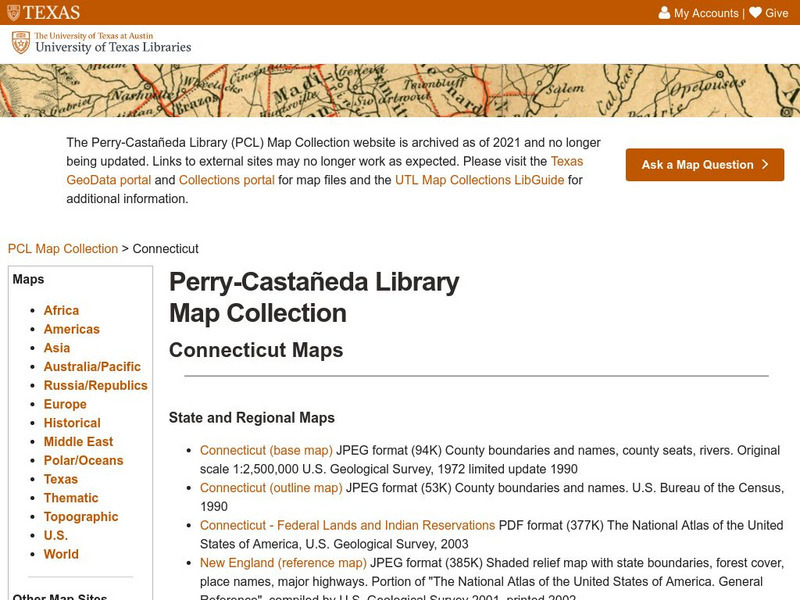
Ut Library: Perry Castaneda Maps of Connecticut
Includes two maps of the state as well as several topographic maps of cities in Connecticut and one historic map of New Haven in 1920.
University of Texas at Austin
Ut Library: Perry Castaneda Maps of Ohio
A collection of state, city and historical maps of Ohio. Also includes maps of national parks and monuments in the state.
University of Texas at Austin
Ut Library: Perry Castaneda Maps of Alabama
Here you will find state and city maps (including outline and topographical maps) of Alabama. Also includes historical maps and maps of Alabama's National Parks.
Curated OER
University of Texas: Turkmenistan Shaded Relief Map
This relief map of Turkmenistan from the Perry Castaneda collection shows the topography of the country along with its bodies of water.
Curated OER
University of Texas: Afghanistan: Topography
A 1986 topographical map of Afghanistan from the Perry-Castaneda Collection. You can clearly see the mountain ranges, valleys, and passes that make up this mountainous country.
CK-12 Foundation
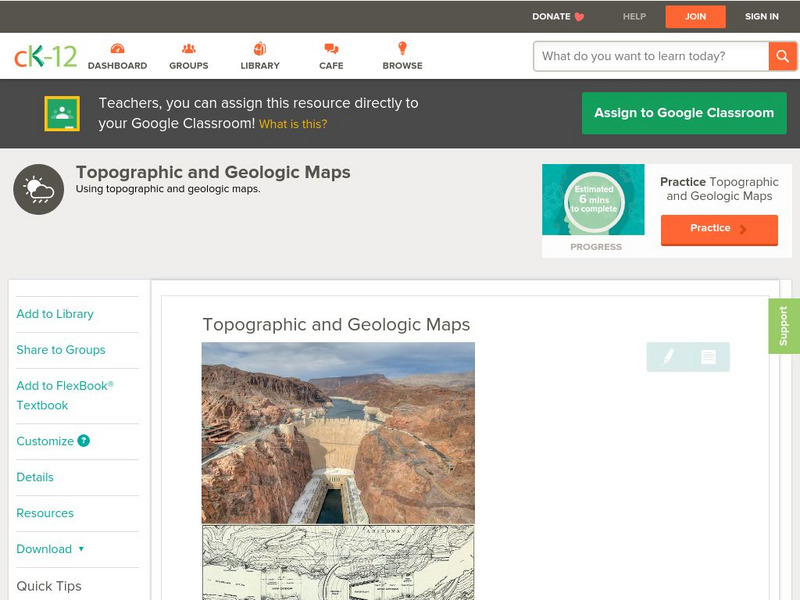
Ck 12: Earth Science: Topographic and Geologic Maps
[Free Registration/Login may be required to access all resource tools.] How to use topographic and geologic maps.
Science Education Resource Center at Carleton College
Serc: Visualizing Topography
This module helps students learn to identify terrain features on topographic maps. Students manipulate animations of hills, valleys, and cliffs to see the terrain from various angles. The module also provides instruction on how to read...
Science Education Resource Center at Carleton College
Serc: Map and Compass Lab
Science Scope article presents an activity on topography and land masses that helps students learn about scientific inquiry. Students also practice making and interpreting scale drawings and learning about computation, estimation and new...
University of Texas at Austin
Ut Library: Perry Castaneda Maps of Massachusetts
A collection of current and historic maps of Massachusetts, along with maps of cities and national parks in the state.
Climate Literacy
Clean: Impacts of Topography on Sea Level Change
Students use web-based animations to explore the impacts of ice melt, specifically changes to sea level. They also use topographic maps to examine the relationship between topography and sea level change by mapping changing shorelines.
Science Education Resource Center at Carleton College
Serc: Investigating Contour Maps: Creating Contour Maps by Surveying
In this activity, the students will understand how contour maps are created and appear the way that they do by using various materials to create and compare contour lines of different elevation levels.
Science Education Resource Center at Carleton College
Serc: Topographical Maps, Contour Lines and Profiles
In this mapping field lab middle schoolers determine the elevation of a given object in a designated area on the school campus using cartography tools. Then they use of these tools to create a contour map of the area.
Math Science Nucleus
Math Science Nucleus: Topographic Maps
For a picture of a topographical map, go to this page. There is some information to help you understand what they are.
Enchanted Learning
Enchanted Learning: Topographic Map Activity
An activity to practice interpreting contours.
Science Education Resource Center at Carleton College
Serc: Choosing the Best Contours
Using GeoMapApp's interactive elevation base map, experiment to find the best contours for sensibly displaying topography in different landscape regions. Young scholars use contours in different landscape regions to find contour...
Science Education Resource Center at Carleton College
Serc: Sandbox Modeling
Students create landforms using layers of colored sand, then construct a topographic map and a cross-section. This is an investigation that was presented to pre-service science teachers. The format would be similar with students, with...
Science Education Resource Center at Carleton College
Serc: Discovering Plate Boundaries
A data rich exercise built around four global data maps to help students discover the processes that occur at plate tectonic boundaries. The lesson is based on the jigsaw concept, mixing the students to work in different groups during...
Science Education Resource Center at Carleton College
Serc: Examining Topography Stream Discharge Sherburne National Wildlife Refuge
Students problem solve stream discharge by estimating, measuring, and collecting data. Students graph actual contour lines, and use these measurements to hypothesize stream discharge and sediment load from a restored wetland using a dry...
Curated OER
Educational Technology Clearinghouse: Maps Etc: Crater Lake, Oregon, 1916
A contour map from 1916 of Crater Lake in Oregon, showing elevations in feet above sea level. Crater Lake lies within the caldera of an extinct volcano (Mount Mazama), and the map indicates its depth at 2000 feet, surface elevation at...
Curated OER
Educational Technology Clearinghouse: Maps Etc: Mesa De Maya, 1911
A contour map from 1911 of Mesa de Mays in Animas County, southern Colorado. The map shows the typical topography of a lava-capped mesa, with steep bordering scarps and a flattish summit.
Curated OER
Educational Technology Clearinghouse: Maps Etc: Georgetown District, 1906
A contour map from a portion of the USGS Georgetown quadrangle (1906) showing the present topography of the Georgetown district of Colorado. Contour intervals are 500 feet.
Other popular searches
- Contour Maps Topography
- Maps Topography
- Topography Maps of Europe
- Political, Topography Maps
- Inca Topography Maps


