Curated OER
Slopes and Lines
Pupils identify the slopes of a line. In this algebra activity, students calculate the slope and intercept of a line. They graph their lines using a TI calculator.
Curated OER
Finding the Extrema Graphically and Symbolically
In this extrema worksheet, students use the first derivative test and the second derivative test to determine the local extrema. They identify the local maximum and global maximum. This eight-page worksheet contains detailed...
Curated OER
Means of Growth
High schoolers collect and graph data. In this statistics instructional activity, students analyze their plotted data using a scatter plot. They identify lines as having positive, negative or no correlation.
Curated OER
Mean, Median, and Mode
Eighth graders practice using the LIST key on graphing calculators using the proper syntax. They work with the functions of mean, median, and mode in a teacher led instructional activity and then with a partner on a second data set. They...
Curated OER
Going Back to Your Roots
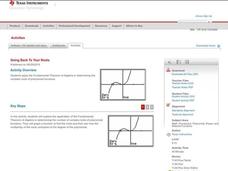
Who doesn't need to know the Fundamental Theorem of Algebra? Use the theorem to find the roots of a polynomial on a TI calculator. The class explores polynomials with one solution, no real solutions, and two solutions. This less lesson...
Curated OER
Visualizing Vectors
Investigate vectors in standard positions and use the CellSheet application on the TI calculator to find the sum of two vectors. Convert from polar to rectangular coordinates and vice versa, and show graphs of the vectors.
Curated OER
Betweenness and the Sum of Parts
High schoolers differentiate lines and angles using betweenness in this geometry activity. They differentiate angles and lines using Cabri Jr. and analyze the data and make conjecture.
Curated OER
Baseball Statistics
Students take an in depth examine baseball record breakers. They calculate statistics, not just for one year, but over whole careers, to compare some famous players and find who was the best all-time home run hitter.
Curated OER
Big Wheels Keep on Turning
Eleventh graders work in groups and investigate how force determines the speed and distance then they view the video, "Math Vantage #7: What's Your Angle?." They are given a real life problem to solve using speed, ramps, angle, incline...
Curated OER
Regressive Music
Student use the Ti calculator to graph sinusoidal graphs. In this calculus lesson plan, students use the CBL to collect and analyze data of sinusoidal graphs. They manipulate their collected data and make predictions.
Curated OER
The Swinging Pendulum
Students observe a pendulum and graph their observation. In this algebra lesson, students use the TI calcualtor to graph the motion the pendulum makes. They analyze the graph and make predictions.
Curated OER
"You're Hired!'
Students investigate linear programming using the TI. In this algebra lesson, students collaborate and graph linear inequalities on a TI. They analyze their data and present it to the class.
Curated OER
Exploring Exponential Growth and Decay Functions
Learners differentiate between exponential growth and decay. In this algebra instructional activity, students solve exponential equations using properties of exponents. They use the Ti calculator to graph and analyze their...
Curated OER
Worksheet #2.6: MT-A141 PreCalculus
In this graphing worksheet, students predict how a graph of given functions will work. Next, they check their work using a graphing calculator. Students use algebra to complete the graph of a square and determine transformations.
Curated OER
Worksheet 2.4/2.5: MT-A141 PreCalculus
In this precalculus instructional activity, students use their graphing calculator to graph the domain and range of given terms. They write parametric equations and identify the coordinates of the points on the relation given certain...
Curated OER
Elements of a Short Story
Students analyze elements of a short story by working together. In this literature lesson, students analyze short stories. They use the TI Navigator Application to write their findings.
Curated OER
Round and Round and Round We Go!
Pupils investigate motion using a CBL. For this algebra lesson, students collect and graph data on a coordinate plane. They define and identify amplitude and period of conic graphs.
Curated OER
Decode Word Is..
Learners solve problems using patterns. In this algebra lesson, students identify the relation, domain and range of a function. They graph functions using coordinate pairs.
Curated OER
Standard Form of Equations
Learners complete the square and identify different parts of a quadratic equation. In this algebra lesson, pupils graph conics using the TI calculator. They rewrite equations by completing the square.
Curated OER
Midpoint of a Segment
Learners revisit midpoint and segments by graphing on the TI or computer. This activity can be done with pencil and paper, but is more interactive if it is done on a TI-navigator.
Curated OER
Wrapping It All Up
Through learning how to examine linear, quadratic, and exponential functions, young scholars explore the effects of changes in parameters on the graphs of linear, quadratic, and exponential functions. The lesson is designed to be a...
Curated OER
Hit and Run
Pupils explore data collection in this lesson. They investigate distance vs. time and velocity vs. time graphs using information collected with a CBR 2 to simulate the reconstruction of an accident.
Curated OER
Slow Down - Speed Up
Pupils explore the concept of distance and time as they use a CBR to mimic distance v. time graphs. Learners walk towards and away from the monitor to create various distance v. time graphs, then discuss what motion creates certain graphs.
Curated OER
Multiplying Monomials
Students differentiate between linear and quadratic functions. For this algebra lesson, students write equations of graphs and graph a function from an equation. They also identify the slope and y-intercept.
