Curated OER
Data Analysis and Probability: Graphing Candy with Excel
Collect and graph data using Microsoft Excel with your math class. They will make predictions about the number of each colored candy in a bag of M&M's, then sort, classify, count, and record the actual data before using Excel to...
Curated OER
All About Graphs
Students practice organizing data by creating graphs. In this statistics lesson plan, students survey the class about favorite colors and create a bar graph using the data. Students complete a test based on pet and animal...
Curated OER
Excel Lesson
Students investigate Microsoft excel. In this technology lesson, students create formulas using excel and apply these formulas to solve relative, absolute and mixed reference cells. They perform immediate and delayed calculations.
Curated OER
Speed + Graphing = Winners!
Fifth graders take addition timed tests every day for a two week period. Using the data from the timed tests, they create a bar graph using Microsoft Excel computer software, a personal bar graph using graph paper and colored pencils,...
Curated OER
Survey Project
Eighth graders create a website using FrontPage. They use inserted forms to collect survey information and use Microsoft Excel and MS Word to create a presentation of the survey and the results.
Georgia Department of Education
Analytic Geometry Study Guide
Are you looking for a comprehensive review that addresses the Common Core standards for geometry? This is it! Instruction and practice problems built specifically for standards are included. The material includes geometry topics from...
Curated OER
Mystery Spill
Students investigate the cause of birds dying in Monterey Bay. In this scientific research lesson, students use various resources, scientific investigations, and vector analysis to solve an environmental mystery.
Curated OER
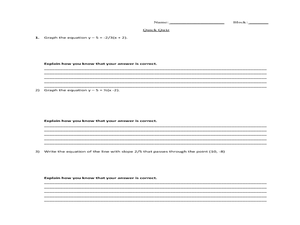
Slope, slope-Intercept Form and Standard Form
Students investigate and solve linear equations using slopes. In this algebra activity, students graph lines using the slope and y intercept. They also find the slope by rewriting their equation in to slope-intercept form from standard...
Curated OER
A Measuring Adventure
Students practice measuring items. In this measurement lesson, students read the book Measuring Penny and create their own system of measurement. Students measure various items in the classroom, using their creative measurement system.
Curated OER
Fractions, Decimals and Percents
Fifth graders describe parts of a whole as a fraction, decimal and a percent. In this math lesson plan, 5th graders practice converting fractions to decimals by dividing. Additionally, students explain how decimals are converted to...
Curated OER
"it's All in the Cellar"
Seventh graders examine the process of constructing a site plan map at archaeological sites. They discuss the process of mapping techniques and calculation of percentages, create a plan site map of a cellar at Jamestown, and calculate...


