Hi, what do you want to do?
Curated OER
Nasa's Return To Flight: Testing In
Students explain basic components of the space shuttle stack and the chemical fuel makeup and storage used on the external tank of space shuttle. They discuss findings of Columbia mission accident. and the safety improvements that have...
Curated OER
Queen Elizabeth II Addresses United Nations
Students examine an article that discusses Queen Elizabeth's address to the United Nations General Assembly. In this lesson, students complete several assignments that are centered around the topic of the article, including vocabulary,...
Curated OER
Rain Making - Understanding the Formation of Rain
Students read and conduct and experiment to learn about rain formation. In this water forms lesson, students read about the formation of rain and its purposes. Students then complete a rain experiment activity.
Science Education Resource Center at Carleton College
Serc: How Does the Temperature of the Great Lakes Change Over Time?
This activity allows students to use water surface temperature, bathymetric data, and weather data to look at trends in the water temperature of the Great Lakes.
Concord Consortium
Concord Consortium: Smartgraphs: Graphs Tell a Story
Students match a word story to the correct set of graphs involving temperature change over time.
Science Education Resource Center at Carleton College
Serc: Investigating Temperature: Using a Thermometer
In this activity, students will record the high/low temperature daily throughout the school year and observe the change over time (phenology). They will analyze the data monthly and make predictions about the temperature.
King's Centre for Visualization in Science
Explaining Climate Change: Lesson 2: Is Climate Change Happening?
This is the second lesson in a series of learning modules on the topic of climate change. It examines what climate change is, how it relates to greenhouse gas concentrations over time, and temperature trends. Includes comprehension...
US Geological Survey
U.s. Geological Survey: Greenhouse Gases [Pdf]
Lesson plan in which students observe and contrast thermal properties of three major greenhouse gases. Using simple, readily available materials, students collect temperature change over time for dry air, water-saturated air, carbon...
New York Times
New York Times: How Much Hotter Is Your Hometown Than When You Were Born?
[Free Registration/Login Required] This New York Times interactive lets you type in name of your hometown (or any town) and the year of your birth. It will then show you the number of increased days the temperature there has been over...
NASA
Nasa: Sea Surface Temperature Trends of the Gulf Stream
Students investigate changes in the surface temperatures of the Gulf Stream over the course of the seasons using data collected by NASA's satellites. The data is inputted into a spreadsheet and graphed.
TeachEngineering
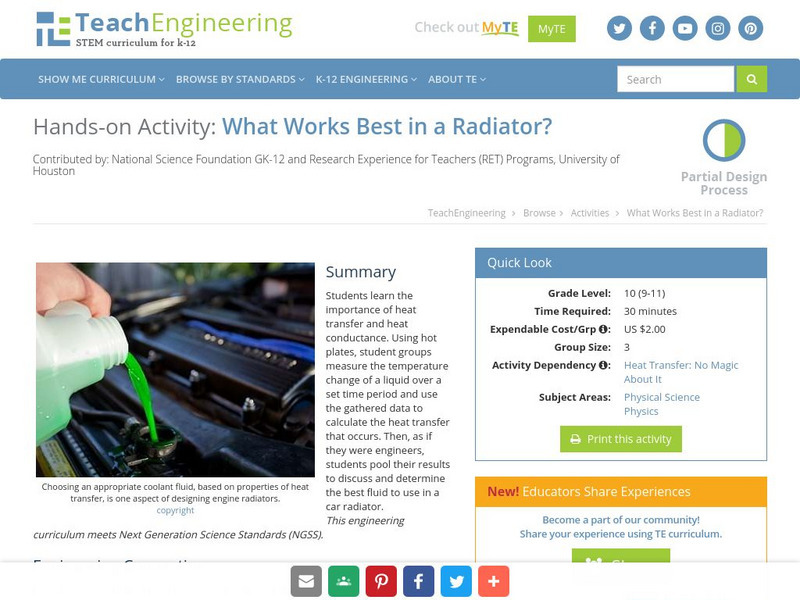
Teach Engineering: What Works Best in a Radiator?
Students learn the importance of heat transfer and heat conductance. Using hot plates, student groups measure the temperature change of a liquid over a set time period and use the gathered data to calculate the heat transfer that occurs....
National Earth Science Teachers Association
Windows to the Universe: Feeling the Heat
In this activity students learn about the urban heat island effect by investigating which areas of their schoolyard have higher temperatures. Then they analyze data about how the number of heat waves in an urban area has increased over...
TeachEngineering
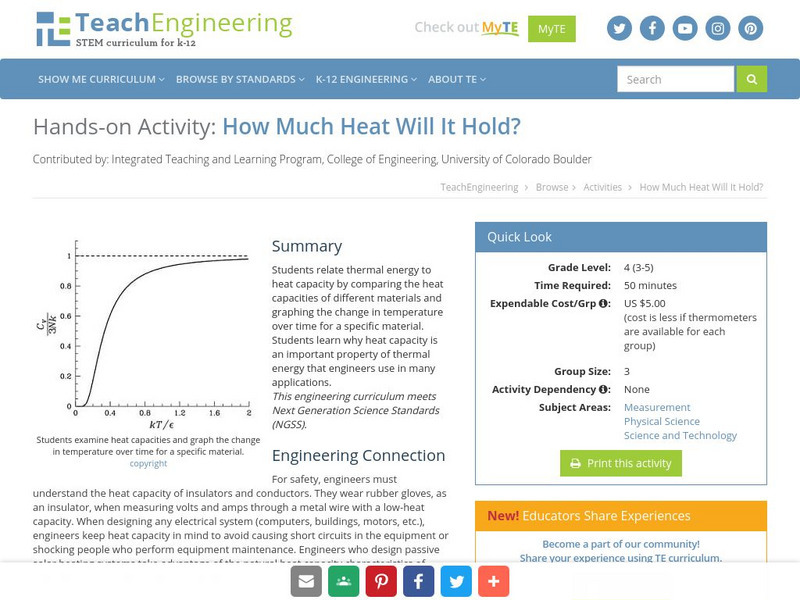
Teach Engineering: How Much Heat Will It Hold?
Students relate thermal energy to heat capacity by comparing the heat capacities of different materials and graphing the change in temperature over time for a specific material. Students learn why heat capacity is an important property...
NOAA
Noaa: Estuaries 101 Curriculum: Chemistry in an Estuary
This activity introduces students to the complex chemistry of estuarine water. Students investigate how chemical and physical water quality factors-pH, temperature, dissolved oxygen, and salinity-change and interact over varying time...
Curated OER
Educational Technology Clearinghouse: Maps Etc: Summer Monsoon in India, 1910
A map from 1910 of the Indian subcontinent and the Central Asia region showing the typical rainfall distribution patterns during the summer monsoons, keyed to show areas of rainfall ranging from very light to, according to this text, the...


