Curated OER
Grade 5: Multiple Towers
Fifth graders use interlocking cubes to build towers to represent factors of numbers and place the towers in the appropriate places on a Tower chart in order to look for patterns. They work in partner groups, and finish by writing...
Curated OER
Grade 3: What Can I Make with 30 Centimeters?
Third graders create polygons with perimeters of 30 centimeters, use the centimeter grid paper to determine the area of each shape, and organize the shapes to make generalizations from the patterns they see.
Curated OER
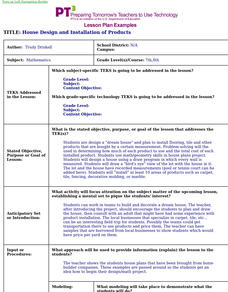
House Design and Installation of Products
Learners design a "dream house" and plan to install flooring, tile and other products that are bought by a certain measurement. Problem solving be used in determining how much of each product to use and the total cost of each installed.
Curated OER
Buttons, Buttons, Everywhere!
Students compare, sort, and describe shapes. Using a button collection, students identify the shape, color number of holes, etc. Students play a description game with the buttons. They create a chart and name items that are the same...
Curated OER
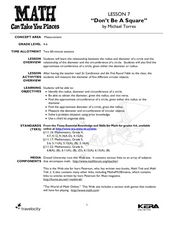
Don't Be a Square
Students analyze the relationship between radius and diameter. Students read Sir Cumference and the First Round Table then take measurements of circular items from around the room. Students compute the radius, diameter...
Curated OER
On the Road Again
Students work with patterns to develop formulas that will help them determine total cost. In this patterning activity, students watch a video about an NBA trainer. (not included) They work in groups to access the assigned Internet...
Curated OER
Identical Twins
Sixth graders work with equivalent fractions, decimals, and percents. In this equivalency lesson, 6th graders participate in a number of activities aimed at increasing their understanding of equivalent expressions. They form a human...
Curated OER
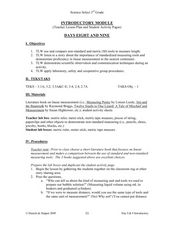
Introductory Module
Third graders examine the non-standard method of measurement and compare it to the metric system of measurement. In this introductory module lesson, 3rd graders discover the scientific observation. Students also develop communication...
Curated OER
Get On Board
Students create a ticket table illustrating the cost of tickets by alternative transportation. In this number sense lesson, students write number sentences to compare and contrast difference information in their chart. Students figure...
Curated OER
Numbers and Letters
Students engage in a physical activity that helps them to distinguish the difference between numbers and letters.
Curated OER
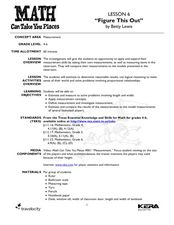
Figure This Out
Learners measure different parts of the human body. In this measurement lesson, students work in pairs to take measurements of human measurements which include: arm span, height, foot length, and wrist to longest finger. They also...
Curated OER
Angles in Triangles
Eighth graders translate word problems using mathematical ideas. In this geometry lesson, 8th graders identify angles of triangles using equations and the triangle sum theorem. They create angles with a protractor and straight edge.
Curated OER
One Hundred Hungry Ants (Multiplication and Division)
Fourth graders explore factors of numbers from 1 to 50. They gain practice with basic facts and multi-digit multiplication problems. Students practice the commutative property. They discover the link between multiplication and...
Curated OER
The Great Pollinators
Young scholars discover the reproductive parts of a plant. In this biology lesson, students identify and categorize several different plants they dissect in class. Young scholars record their information using a data chart.
Curated OER
3-D Attributes
Students explore geometric solids. In this geometry lesson, students listen to the book The Greedy Triangle by Marilyn Burns, then work in groups to sort geometric solids into various categories. Students define geometric solids...
Curated OER
Proportionality, Ratios and Constant Variation
Students use Scion Image to estimate the proportion of space images. In this proportion lesson, students investigate the online site of Image of the Orbitor and relate the dimensions and sizes to known sizes.
Curated OER
Shopping Around
Third graders select a recipe and compare prices for ingredients at two different stores. They select the best place to buy the ingredients and answer questions about the process. They include their data on a spreadsheet related to their...
Curated OER
Math and Science in a Wetland
Students use scientific methods during field and lab investigations. Students collect specimens and make measurements using the metric system. Students describe biotic and abiotic factors in an estuary and design a model.
Curated OER
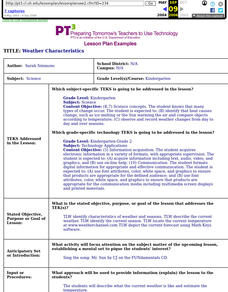
Weather Characteristics
Students identify characteristics of weather and seasons, describe the current weather, identify the current season, and locate the current temperature at www.weatherchannel.com. They also depict the current forecast using Math Keys...
Curated OER
Ordinal Positions in a Sequence
Students study ordinal positions through class reading and discussion, complete an Animal Parade activity sheet and Internet activity to demonstrate knowledge about ordinal positions with 100% accuracy, and play a math computer game.
Curated OER
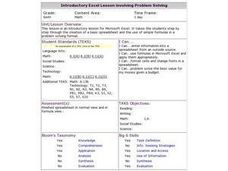
Introductory Excel Lesson involving Problem Solving
Sixth graders analyze an introductory lesson for Microsoft Excel. They go step by step through the creation of a basic spreadsheet and the use of simple formulas in a problem solving format.
Curated OER
Addition Tic Tac Toe
Third graders participate in a game of Tic Tac Toe while practicing addition at the same time. They draw the Tic Tac Toe board with chalk on a concrete portion of the playground. They use bean bags with this activity to make it more...
Curated OER
Odds and Evens
First graders play a game to practice identifying odd and even numbers. They are divided into two teams. If the number chosen out of a bag is odd, the odd team runs back to their goal line while being chased by the even team and vice versa.
Curated OER
Jump and Graph
Third graders practice measuring skills by jumping and measuring the lengths with yardsticks. After measuring five jumps each, they draw bar graphs representing their jumps.


