Curated OER
Collect and Organize Data: Reteach
In this data collection instructional activity, students learn the parts of a tally chart and how it organizes information. Students then use the second tally chart to help them answer the six questions.
Curated OER
Family Size
In this family size activity, students complete a tally chart to determine data from a family size line plot. They organize the data in the chart to determine the mean, median, mode, and range of the data. There are six problems in...
Curated OER
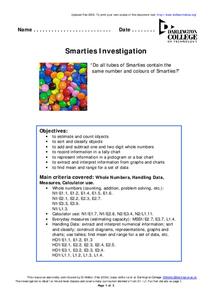
Smarties Investigation
In this math worksheet, students complete a variety of activities using Smarties candy. For example, students estimate the number of each color, count the actual amount, and record their results in a tally chart.
Curated OER
Find Probability
In this probability worksheet, 4th graders answer 6 word problems using a tally chart that contains the results of rolling a dice that has the names of western states on it. They find the median, write fractions that show data, and order...
Curated OER
Tally Time
Students create a tally chart. In this math and health lesson plan, students discuss healthy foods and create a tally chart showing the number of students who like to eat healthy foods.
Curated OER
Favorite Pets
In this tally chart worksheet, learners finish filling in a chart involving a survey of favorite pets from a particular class. Students then answer 4 short answer questions about the results of the survey.
Curated OER
Collect and Organize Data
In this data analysis instructional activity, 4th graders use a tally chart about favorite television programs. They record which are least or most popular, rankings, and combinations of programs.
Curated OER
Smarties Investigation
In this math worksheet, students participate in an investigation of Smarties candy. For example, students estimate how many candies they have in each color, count the actual number, and record the information in a tally chart.
Curated OER
Run, Gingerbread Men, Run!—Game
Run, gingerbread men! During the board game, four gingerbread men race to discover which one finishes first. Scholars take note of the game's results using a tally chart and bar graph for all to observe the frequency of the winning...
Bowland
German or English?
Sprechen sie Deutsch? Future cryptographers must decide whether an unknown text is written in English or in German. They use provided pie charts about the frequency of words in the English and German languages to help make their decisions.
Curated OER
Organizing Data
For this tally chart worksheet, students complete a tally chart of the number of each animal they see in the picture and answer short answer questions about it. Students complete the chart for 5 animals and answer 3 questions.
Curated OER
Make a Tally
In this tally chart worksheet, learners read the word problems and use the information within the problem to make a tally chart. Students use the tally charts to help them finish and solve the word problem.
Curated OER
Tally Marks
In this tally chart worksheet, 1st graders use tally marks to count. Students count the number of stars in each row, keeping a running tally beside each grouping.
Curated OER
Tally Marks
In this tally chart activity, 1st graders use tally marks to count. Students count the number of pumpkins in each row, keeping a running tally beside each grouping.
Curated OER
Histograms: Practice
In this histograms worksheet, students use the bar graph histogram to answer questions 1-4 and the tally chart for question 5. Students finish with two test prep questions.
Curated OER
Read a Pictograph
In this data display worksheet, students solve 4 problems in which data on a tally chart and pictograph are analyzed. Students use this information to solve the problems.
Curated OER
Data Analysis: For Little Learners
Using pictographs, tally charts, and surveys, kids learn all about data analysis and collection. They make surveys, collect data, then construct pictographs and tally charts to organize their information.
Willow Tree
Histograms and Venn Diagrams
There are many different options for graphing data, which can be overwhelming even for experienced mathematcians. This time, the focus is on histograms and Venn diagrams that highlight the frequency of a range of data and overlap of...
Mathed Up!
Tallys and Charts
After watching a brief instructional video, young mathematicians are put to the test. By completing and reading frequency tables, tally charts, and bar graphs, individuals show their understanding of how to interpret data.
Curated OER
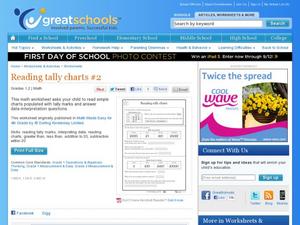
Reading Tally Charts #2
Keep count with tally marks! First graders practice reading tally marks with this straightforward learning exercise. They work with interpreting data from a chart, as well as working with addition and subtraction under 20. A great math...
Curated OER
Recording Frequency
First graders analyze nursery rhymes and gather data about word frequency. In this frequency lesson, 1st graders create graphs and tables. Students interpret the data.
Curated OER
Students Favorites
Students complete activities using a frequency table and construct a pie graph for the data. In this frequency table lesson, students complete a survey to find data for a frequency table. Students use the given link to make a pie graph...
Curated OER
Showing Favorites
In this tally chart worksheet, students use the tally chart on the page to answer 2 questions. They then solve the last 2 questions using their own tally chart.
Curated OER
Tony's Spelling Troubles
Students are introduced to the given problem and describe in their own words the situation represented in a bar chart and tally chart. They then use a bar chart and tally chart to make sensible predictions.
Other popular searches
- Tally Charts
- Tally Charts and Pictographs
- Tally Charts and Tables
- Tally Charts or Pictographs.
- Math Tally Charts
- Primary Tally Charts
- Sorting and Tally Charts
- Tally Charts Mode
- Using Tally Charts
- Lucky Charms Tally Charts
- Birthday Tally Charts
- Tally Charts Lesson Plans


