Curated OER
Inference Lesson Plan
Students practice assessing graphics to infer and identify an author's implicit and explicit meaning in a piece of text. They evaluate the effectiveness of information found in maps, charts, tables, graphs, diagrams, cutaways and through...
Curated OER
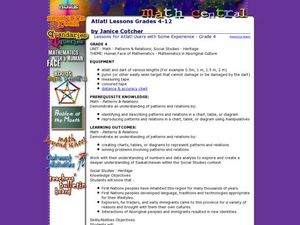
Atlatl Lessons for Grade 4
Fourth graders explore the weapons of the Aboriginal people. In this fourth grade math lesson, 4th graders create charts, tables, or diagrams to represent patterns and relations. Students investigate which dart length has the...
Curated OER
Doing The School Run
Students explore finding the percent of a numbers. They survey their peers to determine modes of transportation used in getting to school. Afterward, students organize information and create graphs and charts. They explore alternative...
Curated OER
Evaluating Data
In this data activity, students learn how to organize the data collected during an experiment and practice finding patterns. Students graph a table of experimental data and complete 1 short answer question.
Curated OER
How Many Toothpicks?
Students investigate different geometric patterns. In this geometry lesson, students create different shapes using toothpicks. They create different patterns and designs and complete a charts using different measurements.
Curated OER
Energy Costs of Walking and Running
In this energy learning exercise, students use a data chart comparing the energy used while running and walking to create a graph and complete 2 short answer questions.
Curated OER
The Cost of Raising a Child
Young scholars study the cost of raising students based on different geographic locations and income levels. They study tables from the USDA and listen to audio tapes.
Curated OER
Data Collection and Presentation
Students concentrate on discrete quantiative data. They are shown that the vertical line diagram as a more appropriate way to present discrete quantiative data then bar charts. Students work as a group to help with the interpretation...
Curated OER
Education for Global Peace
Learners survey the class and graph the results. In this graphing and data collection lesson, students conduct a survey to see where their shirts were produced. Individuals use software to graph the results and create a written...
Curated OER
A Look at Race in America Using Statistics
Eleventh graders explore the issue of racism in America. In this American History instructional activity, 11th graders analyze charts and graphs on blacks and whites in America.
Curated OER
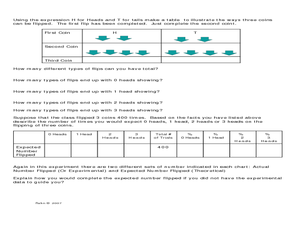
Let's Flip a Coin
In this probability instructional activity, students use a TI graphing calculator to simulate flipping a coin and compare their results (experimental probability) to the expected results (theoretical probability). The five page...
Curated OER
Lesson Six: Nonfiction Text Elements (Part One)
Students examine nonfiction text elements in preparation for writing a nonfiction book about Lewis and Clark. In this social studies/language arts lesson, students discuss the term research and complete a cluster map. Additionally,...
Curated OER
Mathematical Magazines
Students classify and tabulate the type of advertisements found in a collection of magazines. Determination is made on what percent of the total number of ads each type represents. They present their results orally and in a graph.
Curated OER
Jumping in the Air - What was your Height?
Students solve equations using the quadratic formula. For this quadratic equations lesson, students use digital cameras to film students jumping and import film clips into a computer. Students use the data in the quadratic formula...
Curated OER
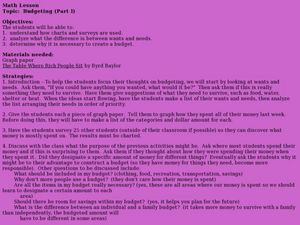
Budgeting (Part 1)
Students examine why a budget may be helpful. In this budgeting lesson, students graph how they spent money during the past week. They discuss the benefits of creating a budget and explore the difference between wants and needs.
Curated OER
Cold Enough?
Students read and record temperatures and display the data. They represent the temperatures on an appropriate graph and explain completely what was done and why it was done. Students display the data showing differences in the daily...
Curated OER
Trouble in the Troposphere
Students Use data sets from MY NASA DATA to produce graphs comparing monthly and yearly ozone averages of several U.S. cities. They analyze and evaluate the data and predict trends based on the data. In addition, they discuss and...
Curated OER
Weather Awareness
Second graders investigate weather. In this weather lesson, 2nd graders discover how to read a temperature gauge, keep track of the weather, and find out how the weather affects their day. They work individually and in partners to make...
Curated OER
Linear Functions
Students solve and graph linear equations. In this algebra lesson, students collect data and plot it to create a linear function. They identify the domain and range of each line.
Curated OER
Analyzing Health
Third graders analyze their health. In this analysis lesson plan, 3rd graders rate their health on a 1-10 scale. They then tally the scores from the class and create a data chart. Then they answer true and false questions based on...
Curated OER
From Sea to Shining Sea
Students study the geography of the United States of America. Students write letters, create travel brochures, make maps, graph population numbers, read fiction and nonfiction selections, complete KWL charts, and watch films.
Curated OER
Particle Physics- Activity Five
In this particle physics worksheet, students use graphs and tables to predict the particles formed during a specific observation event. They complete 5 multi-part fill in the blank questions.
Curated OER
Seed Growth
Young scholars develop an independent procedure to investigate the germination of two types of seeds. Students must construct data tables or charts to record observations and results, graph the data, and analyze the data.
Curated OER
Understanding Europe: A Cultural Mosaic (Theme 1)
Students discuss the cultural similarities and differences found in Northen Europe, Southern Europe, Western Europe, and Eastern Europe and create daily journal entries charting their discoveries. This lesson is the First Part in a Four...
Other popular searches
- Charts Graphs and Tables
- Tables, Graphs, Charts
- Graphs Charts Tables
- Maps, Charts, Graphs, Tables
- Charts, Tables, Graphs
- Charts, Graphs and Tables

