Curated OER
Maximize It!
Pupils design a rectangular box without a lid that has the largest possible volume using the supplied sheet of centimeter graph paper. They work in groups to construct different size boxes to determine the largest possible volume and...
Curated OER
How Alike Are We?
Fourth graders find the range, mode, median, and mean for each of the data sets (height and shoe size). They discuss which measure of central tendency for each data set best represents the class and why. Students graph the shoe size and...
Curated OER
Fractions and Measurement
Using a Smart Board, or a plain ol' white board or chalkboard, the teacher pulls up a grid and demonstrates how squares and rectangles can be divided up into equal parts. The class will get their own graph paper to draw shapes and divide...
Curated OER
Graph Both Crusts
Fourth graders calculate the angles and construct a pie graph of the percentages of the elements in the continental and oceanic crusts. Then they analyze the results. They can be assigned the task of researching the percentages.
Curated OER
Graphing
Fifth graders create graphs based on climate in South Carolina. They read and interpret information in a chart and construct a graphy from the information in the chart. They create a spreadsheet using Excel and publish 2 graphs.
Curated OER
Graphing and Analysis of Water Quality Reports
Students practice making graphs and interpreting them. They compare and contrast different sets of data. They use Microsoft Excel to create different types of graphs.
Curated OER
Graph Your Foot!
Students measure their own foot and place the outline on a graph. They make connections between the size of their foot and the bar graph that represents it.
Curated OER
Let's Graph It!
Students graph the height of others in centimeters and inches, find the slope of line in order to calculate the conversion factor between centimeters and inches.
Curated OER
Data Analysis Digital Display
Students create a survey online. In this math lesson plan, students graph survey data using flisti.com. They share and analyze their classmates' histogram.
Curated OER
Positive Future Fair Project
Ninth graders view the film "Pay It Forward" and discuss what kind of public campaign is needed to move people to positive action. They consider different ways of presenting information (graphs, visual displays, etc.) as tools for...
Curated OER
Tally Chart Practice
In this tally chart worksheet, students will read about tally charts and their uses. Students will make a list of when and why they could make a tally chart. Next students will complete a tally chart and write statements about the...
Curated OER
Obstacles to Success: Misleading Data
Eleventh graders explore how data reported by country agencies can mislead the public intentionally or unintentionally. For this Cross Curricular activity, 11th graders analyze charts and graphs in order to draw conclusions. Students...
Bowland
Mystery Tours – Plan Your Tour
Everyone loves a vacation and a set of three activities has groups planning a tour of the U.K. using given distance, time, and price data. They solve a variety of problems related to the trip and produce a report on the success of...
Radford University
Sleep and Teen Obesity: Is there a Correlation?
Does the number of calories you eat affect the total time you sleep? Young mathematicians tackle this question by collecting their own data and making comparisons between others in the class through building scatter plots and regression...
Curated OER
Let's Plot Points
Use coordinate grid paper to plot points and identify shapes that are already plotted on the paper by saying their coordinates. Pupils also measure the distance between points and play the game Battleship. There are several web links and...
Curated OER
Where Are the Bugs?
Students trap, collect and identify arthropods in a newly created desert tortoise preserve area over a period of one school year. They determine the rate at which various arthropods take up residence in the newly landscaped area. Data is...
Curated OER
Endangered Species
Ninth graders graph data in order to compare the number of extinct species and a rise in human population. They analyze the data collected. Students are encouraged to infer the relationship.
Curated OER
Heartbeat Project
Students enter information about their heartbeats into a spreadsheet. They construct data displays and calculate statistics. They describe and justify their conclusions from the data collected.
Curated OER
Excel Lesson Plan Coin Statistics
Second graders determine the difference between making a prediction and determining actual information. They design a spreadsheet for a coin flipping activity on which they include their predictions and what actual happens when they flip...
Curated OER
Death by Particles
Emerging epidemiologists define relative risk and read an article about the effect of particulate pollution on the cardiovascular health of women. They record the relative risk values, graph them, and answer analysis questions. This is a...
Curated OER
Molecular Biology and Primate Phylogenics
By counting differences in amino acids, biology stars examine the relationships between different primates. With information gleaned, they map out a phylogenic tree and discover common ancestry. You will need to create printable versions...
Curated OER
Market Basics: Demand, Supply, and Price Determination
Students are introduced to the concepts of supply and demand. Using the Law of Demand and Supply, they develop charts and graphic models of supply and demand. They compare and contrast the behavior of consumers and suppliers when there...
Curated OER
Indian Women in Texas History
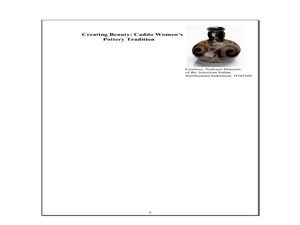
Fourth graders study Indian women in Texas. In this US history lesson, 4th graders discuss what each Indian woman's contribution was by completing a timeline and table. Students examine the Caddo Women's pottery tradition...
Curated OER
Data Analysis
Learners double check their data collections of Top 20 singles that they've been collecting for several days. Types of data is reviewed in detail and a variety of questions are asked for retention factors of mastery. They draw a tally...
Other popular searches
- Charts Graphs and Tables
- Tables, Graphs, Charts
- Graphs Charts Tables
- Maps, Charts, Graphs, Tables
- Charts, Tables, Graphs
- Charts, Graphs and Tables


