Curated OER
Maps and Modes, Finding a Mean Home on the Range
Fifth graders investigate data from maps to solve problems. In this data lesson, 5th graders study maps and collect data from each map. Students present their data in a variety of ways and calculate the mode, mean, median, and range.
Curated OER
Use Google Maps to Teach Math
Capture the engagement of young mathematicians with this upper-elementary math lesson on measuring time and distance. Using Google Maps, students first measure and compare the distance and time it takes to travel between different...
Education World
The African American Population in US History
How has the African American population changed over the years? Learners use charts, statistical data, and maps to see how populations in African American communities have changed since the 1860s. Activity modifications are included to...
Curated OER
Virtual Field Trip
This hands-on resource has future trip planners analyze graphs of mileage, gasoline costs, and travel time on different routes. While this was originally designed for a problem-solving exercise using a Michigan map, it could be used as a...
Curated OER
Virtual Field Trip
Are we there yet? Young trip planners learn about their state and plan a trip. They will select sites to see in three cities in their state, and record associated costs in a spreadsheet. While this was originally designed as a...
Curated OER
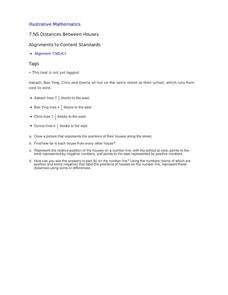
Distances Between Houses
This resource sneaks in the math so your learners will be adding and subtracting positive and negatives on a number line while thinking they are mapping out houses. The activity starts by putting houses the appropriate distance away from...
Virginia Department of Education
Functions 1
Scholars learn what it means for a relation to be a function and see various representations of functions. After learning the definition, they participate in a card sorting activity classifying relations as functions or not.
Curated OER
Tables, Charts and Graphs
Learners examine a science journal to develop an understanding of graphs in science. In this data analysis lesson, students read an article from the Natural Inquirer and discuss the meaning of the included graph. Learners create a...
Curated OER
Application of Graph Theory
Learners investigate different online tutorials as they study graphing. In this graphing lesson, students apply the concept of graphs cross curricular and use it to make predictions. They define the purpose and theories behind graphs.
Curated OER
Hopes and Dreams: A Spreadsheet Lesson Using Excel
Fourth graders read "The Far Away Drawer" by Harriet Diller and discuss the story as a class. After discussion, 4th graders create a t-shirt GLYPH about their hopes and dreams,share their information with the class and create spreadsheets.
Mathed Up!
Negative Numbers
Individuals read tables with temperatures and times in order to distinguish the town with the lowest temperature or most extreme temperature difference. Each of the eight questions has three sub-questions that use the same charts.
Curated OER
Analyze This
Students gain practice in the analysis of various types of graphs common in daily life. These examples often use graphic images like charts, graphs, tables, and pictures to supplement learning.
Curated OER
Local Traffic Survey
Students conduct a traffic survey and interpret their data and use graphs and charts to display their results.
Curated OER
Statistical Diagrams
In this statistics activity, students explore five activities that require analysis and interpretation of maps, charts, and scatter plots. The six page lesson includes five activities or experiments with short answer questions. Answers...
Curated OER
What Time Is It?
Fourth graders distinguish between analog and digital clocks and read time from both types. In this clock reading instructional activity, 4th graders discuss the types of clocks and the time zones. Students find times in specific time...
Curated OER
The Good, The Bad, The Ugly
Sixth graders examine the causes of the stock market crash of 1929. In this integrated math/history unit on the stock market, 6th graders study, research, and read stocks, visit a local bank, and create a PowerPoint to show the finished...
Curated OER
Weather Watchers
Students are introduced to an Underground Weather Stations. In groups, they use the internet to research the weather in different parts of the United States locating each city. To end the lesson, they summarize the information they...
Curated OER
Jelly Bean's Galore
Students investigate the origins of the Jelly Bean. They complete a Scavenger Hunt using the jellybean website. Pupils create a bar graph using information collected about jelly beans. Students discuss the time of year that Jelly Beans...
Curated OER
Scuba Diving in Belize
Students plan a scuba diving trip to Belize. In this planning a scuba diving trip to Belize lesson, students research about the barrier reef in Belize. Students make travel plans that involve finding distance, time, and cost of...
Curated OER
What Do We Do With A Dirty Bomb?
Students examine composition of dirty bomb and its possible effects on a city, and investigate simulations of such an event; students use computational and problem solving skills to assess damage and prepare report proposing solution to...
Curated OER
One Size Fits All?
Learners describe the differences between an estimate and a guess. They create reasonable estimates based on comparison and activities. Students explain how estimation is helpful in showing the relative size on a scale. They also...
Curated OER
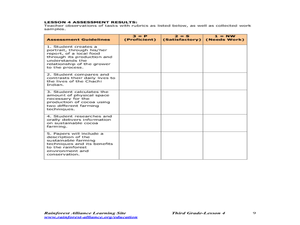
Equadorian Rainforest: The Tropical Supermarket
Young scholars study the concept of sustainable agricultural practices through cocoa farming and the lives of the people who are the producers. Students watch a slide show and read a story which helps them understand the origins of...
Curated OER
Hurricane Frequency and Intensity
Students examine hurricanes. In this web-based meteorology lesson, students study the relationship between ocean temperature and hurricane intensity. They differentiate between intensity and frequency of hurricanes.
Curated OER
Groups Coming to America
Fifth graders use text or other references to locate different types of information about the Mayflower and pilgrims. They create a presentation for lower elementary classes about the Pilgrims.


