Soft Schools
Multiplication Table
Use the multiplication table as an aid for young mathematicians who are learning their multiplication facts. Children can explore the concept of multiplication by using the factors in the far left column and the top row to determine a...
EngageNY
Summarizing Bivariate Categorical Data with Relative Frequencies
It is hard to determine whether there is a relationship with the categorical data, because the numbers are so different. Working with a familiar two-way table on super powers, the class determines relative frequencies for each cell and...
EngageNY
Summarizing Bivariate Categorical Data
How do you summarize data that cannot be averaged? Using an exploratory method, learners complete a two-way frequency table on super powers. The subject matter builds upon 8th grade knowledge of two-way tables.
Scholastic
Making the Times Table Mini-Books
What do you get when you combine your traditional times table worksheet with cute worm characters? A fun mini-book that youngsters can enjoy and that will help them practice multiplying by one!
Curated OER
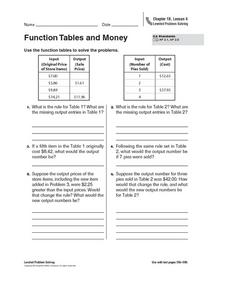
Function Tables and Money
In this function tables, money worksheet, students examine 2 different function tables, where they are given input information. Students determine the rule of the function table, then calculate the missing output values. The first table...
Curated OER
Integrated Algebra Practice: Frequency Histograms, Bar Graphs and Tables
In this graphs learning exercise, students solve 4 problems about histograms, bar graphs, and tables. Students answer questions about histograms, bar graphs, and tables.
Curated OER
Frequency Tables; Discrete Ungrouped Data
In this frequency tables activity, students utilize given data to work out three frequency charts with one containing values and a pie chart involving angles for each value. Students complete three vertical line diagrams and check all...
Curated OER
Function Tables
For this function tables worksheet, 11th graders solve 10 different problems that include completing various function tables. First, they read and identify each rule given for the tables. Then, students use the rule to determine the...
Curated OER
Problem Solving: Use a Table Reteach 16.8
In this problem solving instructional activity, students learn to look for information in a data table. Students answer 6 questions about a data table.
Curated OER
Frequency, Histograms, Bar Graphs and Tables
In this frequency instructional activity, students interpret histograms, bar graphs and tables. They examine frequency charts and comparison line graphs. This three-page instructional activity contains 4 problems. Answers are provided...
Curated OER
Frequency Tables and Stem-and-Leaf Plots
Students are introduced to the function of frequency tables and stem and leaf plots. In groups, they determine the frequency of their teacher coughing, ringing a bell or raising their hand. To end the activity, they determine frequency...
Curated OER
Using a Multiplication Table to Divide
Learners solve division problems. In this multiplication and division lesson, pupils practice using a multiplication table to find a missing factor in a multiplication sentence. They use the same strategy to find a missing quotient in...
Curated OER
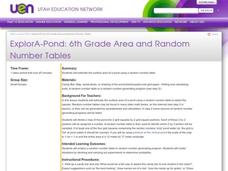
ExplorA-Pond: 6th Grade Area and Random Number Tables
Sixth graders estimate surface area of a pond using a random number table.
Curated OER
Multiplication Table (10 x 10)
In this multiplication practice worksheet, students use their problem solving skills to fill in the blanks in a 10 x 10 multiplication table.
Curated OER
Use or Make a Table
In this use or make a table worksheet, students examine data given in a story problem. They use logic to determine the best way to begin organizing the data and creating a table. This one-page worksheet contains three problems. ...
Math Worksheets Land
Patterns of Association (Using Data Tables) - Independent Practice Worksheet
Here is a worksheet that belongs in a four-part resource that has learners practice using data tables to calculate percentages. The page has ten problems with different data tables asking to find different percents.
Math Worksheets Land
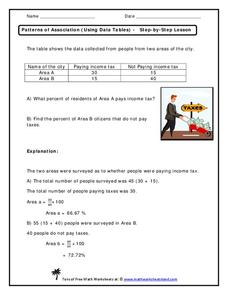
Patterns of Association (Using Data Tables) - Step-by-Step Lesson
This worksheet belongs to a four-part resource that gathers information from data tables to calculate percentages. The page introduces one problem and shares an explanation to the answer.
Curated OER
Multiplication: Table Drills
In this multiplication facts worksheet, learners use their multiplication skills to complete 4 multiplication tables. The tables are 5 x 5 and require students to multiply using the numbers 0-12.
Pennsylvania Department of Education
What is the Chance?
Fourth and fifth graders make predictions using data. For this analyzing data lesson, pupils use experimental data, frequency tables, and line plots to look for patterns in the data in order to determine chance. You will need to make a...
Illustrative Mathematics
Walk-a-thon 1
Your mathematician's job is to explore the relationship between hours and miles walked during a walk-a-thon. The activity compels your learners to experiment with different means in finding out this proportional relationship. The answer...
Illustrative Mathematics
Walk-a-thon 2
During a walk-a-thon your learners must determine the walking rate of Julianna's progress. Using tables, graphs, and an equation, they must be able to calculate the time it took her to walk one mile and predict her distance based on the...
Saxon
Plotting Functions
Youngsters use a graphing calculator to assist in creating a function table. They graph the function on a coordinate plane. They explore the relationship between the domain and range in the graph. This four-page worksheet contains two...
Curated OER
Dot Plots
Number crunching statisticians explore displaying data with dot plots and define the difference between quantitative data and qualitative data. Dot plots are created based on a set of given data and analyzed.
Curated OER
Creating a Thematic Map
Students create and analyze a weather-related data table and a thematic map based upon information provided.
Other popular searches
- Periodic Table
- Multiplication Tables
- Math Tables and Tools
- Function Tables
- Chemistry Periodic Table
- Periodic Table of Elements
- Table of Contents
- Input/output Tables
- Multiplication Tables 1 100
- Frequency Tables
- Input Output Tables
- Data Table


