Curated OER
Decimal Place Value Chart
In this decimal place value chart worksheet, learners work independently to fill in the blanks on the chart so that the numbers equal out correctly and the missing words are stated correctly.
Curated OER
Uniform-Motion Problems: Just Playing with Cars
Students explore the concept of the formula for distance. In this formula for distance lesson, students time battery operated cars with constant velocity over 15 meters. Students use the distance = rate x time formula to determine the...
Curated OER
Frequency, Histograms, Bar Graphs and Tables
In this frequency instructional activity, students interpret histograms, bar graphs and tables. They examine frequency charts and comparison line graphs. This three-page instructional activity contains 4 problems. Answers are provided...
Curated OER
Show Me The Money!
Students select which bank would best meet their needs. In this lesson on personal banking, students write a summary stating which bank and bank accounts best suit their own needs.
Curated OER
Froot Loops to the Max- Pie 2
In this Froot Loops to the Max worksheet, students solve 2 different problems related to graphing data with a box of Froot Loops cereal. First, they complete the circle/pie graph using the given data including a key and a title for their...
Curated OER
Graphing Data
First graders learn how to display data using a bar graph. In this bar graph instructional activity, 1st graders use data from a t-shirt color survey to make a bar graph. They also make an animal bar graph before interpreting the...
Curated OER
The Gathering and Analysis of Data
Young mathematicians gather data on a topic, graph it in various forms, interpret the information, and write a summary of the data. They present their data and graphs to the class.
Curated OER
How Much Will I Spend On Gas?
Students construct a linear graph. In this graphing lesson plan, students determine a monthly budget for gasoline. Students construct a t-chart and coordinate graph to display data. Resources are provided.
Curated OER
A Woman's Place?
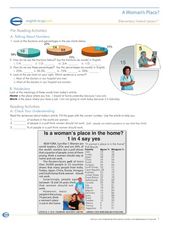
In this women workers lesson, students read an article about women in the workforce and answer 10 questions related to the article. They also convert fractions to percentages.
Curated OER
Addition Number Chart ( 1 to 10, No Clues)
In this math worksheet, students complete an addition chart with sums for 1 to 10. There are no clues on the chart. There is an animal graphic.
Curated OER
Data Analysis
Students double check their data collections of Top 20 singles that they've been collecting for several days. Types of data is reviewed in detail and a variety of questions are asked for retention factors of mastery. They draw a tally...
Curated OER
Questionnaires and Analysis
Students, review the techniques and different types of data analysis as well as how they are expressed, identify why facts and data are needed in conclusion of a questionnaire. The concepts of qualitative and quantitative data are...
Curated OER
Party, Party, Party
Second graders conduct investigations with counting, comparing, organizing, analyzing, displaying and interpreting data. They pose questions for investigation and collect the data. Students display the data in tally charts, uniform...
Curated OER
Time Zones
Students are able to read and also use a variety of timetables and charts. They perform calculations with time, including 24-hour clock times and time zones. These are very important concepts that Students probably have to bear in mind...
Curated OER
Graph Lab
Seventh graders explore bar graphs and pie charts. Given a pack of M&Ms, 7th graders explore the colors, sort the data in a frequency chart and then construct bar graphs and pie charts to categorize the M&Ms by color. Students...
Curated OER
Multiplication Chart
In this math instructional activity, students analyze four multiplication charts. Each chart is illustrated with a different cartoon character.
Curated OER
Dealing With Data
Learners collect, organize, and display data using a bar graph, line graph, pie graph, or picture graph. They write a summary describing the data represented and compare the graph to another graph in the class.
Curated OER
Direct Variation
In this direct variation worksheet, 11th graders solve 11 different problems that include applying direct variation to solve. First, they find the constant of the variation described. Then, students use the charts at the bottom of the...
Curated OER
Cool Times with Heat
Students work with thermometers to complete problems about temperature. They investigate cooling patterns, how location affects temperature, and what happens when water having different temperature is mixed. They measure temperature in...
Curated OER
VARIABLES AND PATTERNS, USE AFTER INVESTIGATION THREE. DISCRETE OR CONTINUOUS LINEAR RELATIONS.
Learners discover for which kind of linear function is appropriate to use the "scatter" or the "connected" term. In this lesson, students investigate functions using variables, patterns book, graph paper, rulers and the graphit program.
Curated OER
Slumber Party
In this food worksheet, students pretend they are going to a slumber party and have to calculate food according to PKU. Students complete 7 questions and 2 charts.
Curated OER
Can you Find the Expression
Students collect data from measurements and weights for this experiment. In this algebra lesson plan, students analyze graphs they create form their data to find the expression representing the data. They label which graph provided the...
Curated OER
Weaving a Story
It's time to investigate patterns! First and second graders construct a paper weaving using a hundreds chart, then use the Ti-10 calculator to make patterns such as adding 3 each time. Learners remove multiples of three from the hundreds...
Curated OER
What's My Function?
Students use input / output tables to help them solve algebraic equations. They use patterns and relations to represent and analyze mathematical situations using algebraic symbols.


