Curated OER
Mobile vs. Money
Learners research the internet and use the information they find to plot straight line graphs. They use graphs to make comparisons of the various packages offered. Students interpret graphs and solve problems based on varying parameters.
Alabama Learning Exchange
Graphing Stations
Pupils explore the concept of graphing stations. In this graphing stations lesson, students head to various teacher set-up stations involving slope, point-slope, standard form, parallel lines, etc. Pupils work problems at each station...
Curated OER
Linear Graphs and Equations
In this linear graphs and equations learning exercise, students examine points on a graph and identify coordinates plotted on the point. Students determine the slope of a line and write the equation of a line. This three-page learning...
Curated OER
Problem Solving: Graphing Functions
In this graphing functions worksheet, students solve 6 word problems, finding ordered pairs, missing coordinates and numbers, slopes of lines and functions.
Curated OER
Inverse of a Function
In this inverse of function worksheet, 10th graders solve and graph 10 different problems that include graphically represented inverse functions. First, they solve each of the problems involving graphs and their inverses. Then, students...
Curated OER
Interpreting and Displaying Sets of Data
Students explore the concept of interpreting data. In this interpreting data lesson, students make a line plot of themselves according to the number of cubes they can hold in their hand. Students create their own data to graph and...
Radford University
Can I Create a Line/Curve of Best Fit to Model Water Drainage?
Learners collect data on the amount of water left in a bottle over time. They graph the data to determine whether the scatter plot shows a curved or straight relationship. Group members then determine an equation for the curve of best...
Curated OER
Constructing Parallel Lines
Students construct parallel lines using a protractor and a straightedge. In this geometry lesson, students identify the properties of parallel lines. They use Cabri to graph and observe the lines.
Curated OER
Generate Measurement Data Word Problems
Plot data for three word problems, each with a table of data. Learners create line plots for these, all of which have only single-digit whole numbers. The large text and few number of problems make this ideal as a whole-class warm up....
CCSS Math Activities
Smarter Balanced Sample Items: 8th Grade Math – Target D
Can learners determine solutions associated with lines? A slide presentation contains sample items for the Smarter Balanced 8th grade math Target D covering solving linear equations and systems of linear equations. Items illustrate the...
Curated OER
Graphing Linear Equations Using Data Tables
Pupils review the Cartesian plane and the process of plotting points. In groups, students create tables, identify the slope and y-intercept, and graph the equation. Afterward, pupils perform the same process, only, individually. As a...
Curated OER
Straight Graph Lines: Coordinates
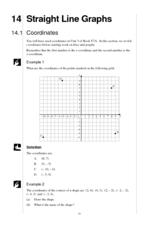
Students access prior knowledge of coordinates. In this coordinates lesson, students graph coordinate points to create a symmetrical figure and of a straight line. Students complete several practice examples.
Curated OER
Worksheet Gr4: Linear Equations
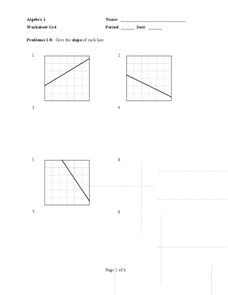
In this linear equations learning exercise, learners solve 24 short answer problems about slope. Students find the slope of a line given a table, graph, two points, and the intercepts.
Curated OER
Basic Algebra and Graphing for Electric Circuits
In this electronics instructional activity, students evaluate mathematical expressions to complete 16 short answer and problem solving questions.
Curated OER
Parabolas
Students investigate parabolas and their equations. In this parabolas and their equations lesson, students graph quadratic equations on their graphing calculator. Students find the axis of symmetry of a parabola. Students discuss the...
Curated OER
Regents Exam Questions: Distance
In this distance instructional activity, students solve 12 multiple choice, short answer, and graphing problems. Students use the distance formula to find the distance between two points.
Curated OER
The Shortest Line Mystery
Students calculate the shortest distance of various scenarios. In this algebra lesson, students interpret graphs of optimization problems. They use a graphing calculator to assist them in graphing and making predictions.
Curated OER
Point Graphs
Students experiment with point graphs. In this math lesson, students are divided into groups and perform an experiment to see how high a ball bounces, recording their results on a point graph. Students then answer provided questions.
Curated OER
Graphing Nonlinear Equations
Young scholars graph non-linear equations. In this algebra lesson, students investigate different polynomial functions and their shapes. They identify the different powers and zeros.
Curated OER
Graphing Integers
Fifth graders complete an integer graphing activity. In this integer graphing instructional activity, 5th graders use coordinate grids to help them complete linear functions and integer graphing.
Curated OER
Slopes and Lines
Students identify the slopes of a line. In this algebra activity, students calculate the slope and intercept of a line. They graph their lines using a TI calculator.
Curated OER
Linear Graphs and Equations
In this linear graph and equations learning exercise, students calculate the gradient of slopes, and find equations of lines in patterns.
Curated OER
Using Graphs
For this using graphs worksheet, 9th graders solve and complete 6 different types of problems. First, they determine how the transformation shown moves the graph. Then, students find the interval that is defined given the coordinates....
American Statistical Association
Scatter It! (Using Census Results to Help Predict Melissa’s Height)
Pupils use the provided census data to guess the future height of a child. They organize and plot the data, solve for the line of best fit, and determine the likely height and range for a specific age.


