Annenberg Foundation
Annenberg Learner: Organizing Data in a Stem and Leaf Plot
A stem and leaf plot is a graphical representation for investigating variation. You will convert an ordered stem and leaf display grouped by tens into an ordered display grouped by fives.
CK-12 Foundation
Ck 12: Statistics: Stem and Leaf Plots and Histograms
[Free Registration/Login may be required to access all resource tools.] Make and interpret stem-and-leaf plots and histograms for a set of data.
Better Lesson
Better Lesson: Places Everyone. Analyzing and Creating Stem and Leaf Plots
The students will be using discovery techniques to learn about stem and leaf plots.
Purple Math
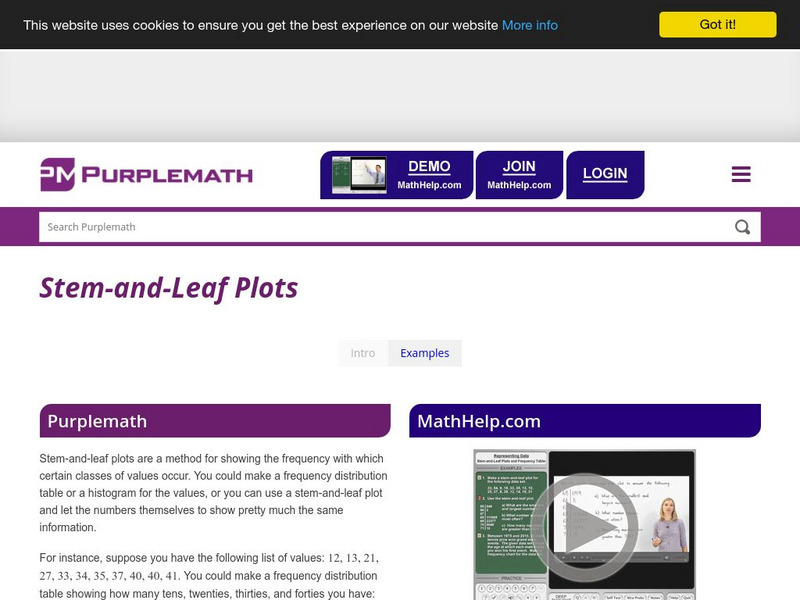
Purplemath: Stem and Leaf Plots
Explains how to create a stem-and-leaf plot from a data set. Demonstrates how to format a clear stem-and-leaf plot.
Other
Stem and Leaf Plotting
A nice explanation of a stem and leaf plot, accompanied by many helpful examples.
Scholastic
Scholastic: Cultivating Data
Students will understand key concepts of data analysis and their graphic representations. Students will construct and interpret data tables, line plots, box-and-whisker plots and stem-and-leaf plots, scatterplots with line of best fit,...
National Council of Teachers of Mathematics
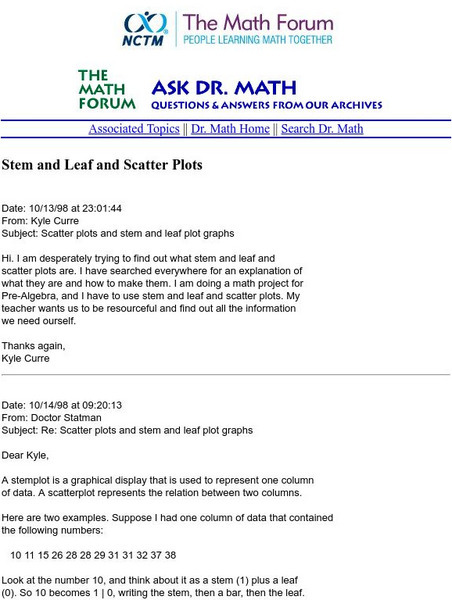
The Math Forum: Nctm: Ask Dr. Math: Stem and Leaf and Scatter Plots
This site is a question/response page which focuses on stem-and-leaf representation and how to construct scatter plots. Dr. Math works through an example and gives commentary notes. Site also contains links for more help.
PBS
Pbs Mathline: Wet Heads Lesson Plan [Pdf]
Students will record the number of drops of water in a stem-and-leaf plot that will fit on top of a penny. Printable lesson.
Alabama Learning Exchange
Alex: Heads Up!
The lesson is a hands-on project. Students will work in pairs to gather various measurements, organizing the data into a provided chart. The measurements will be used to review, reinforce, and introduce skills such as measures of central...
National Council of Teachers of Mathematics
Nctm: Illuminations: State Names
Learners use multiple representations to display how many times the letters of the alphabet is used in a state name. Concepts explored: stem and leaf, box and whisker plots, histograms.
CK-12 Foundation
Ck 12: Types of Data Representation: Graphic Displays of Data
[Free Registration/Login may be required to access all resource tools.] Here you will explore displays of data using bar charts, histograms, pie charts and boxplots, and learn about the differences and similarities between them and how...


