Curated OER
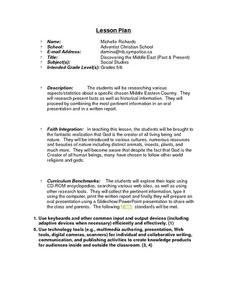
Discovering the Middle East (Past & Present)
Students, after being assigned a specific Middle Eastern Country, research various aspects/statistics as well as historical information on their country. They combine their acquired information in an oral presentation and written report....
Curated OER
Checking Test Comparability/Scattergrams
Students construct a scattergram graph. In this statistics lesson plan, students graph data by hand and using a spreadsheet program. They establish lines of best fit and draw conclusions using their graphs.
Curated OER
Gender Issues through Chi-square Experiments
Students investigate teachers and gender preference. In this statistic lesson, students collect data of teachers calling on students to see if they are calling on one gender more than the other. Students examine the data and draw...
Curated OER
Shut it Off!
Students identify the central tendencies. In this statistics lesson, students find the mean, median and mode of their collected data. They explain the effect of outliers on the data.
Curated OER
Line of Best Fit
Students identify the line of best fit. In this statistics lesson, students collect and analyze data. They calculate the regression equations and identify the different types of correlation.
Curated OER
Misleading Graphs
Students explore number relationships by participating in a data collection activity. In this statistics instructional activity, students participate in a role-play activitiy in which they own a scrap material storefront that must...
Curated OER
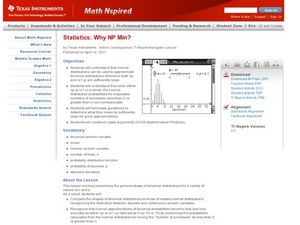
Why NP Min?
Students calculate the normal distribution. In this statistics lesson plan, students use the normal distribution to estimate binomial distributions. They define when to use NP and n(1-p) to make approximations.
Curated OER
The Race of Baseball All-Stars
Collect and analyze data. Pupils graph their data and model with it to solve real life problems. They use logic and deductive reasoning to draw conclusions.
Curated OER
Why Doesn't My New Shirt Fit?
Learners test Leonardo da Vinci's view of the human body by measuring various body parts using a tape measure. They create a data table and a scatter plot and then analyze and interpret the results using a graphing calculator.
Curated OER
Re-Presenting Race in the Digital Age
Teen-aged scientists analyze a graphic organizer of how trash is removed from New York City and then answer standard questions about a graph and a diagram. Resources are mentioned, but there are no links to these resources, so you will...
Curated OER
How Many?
Learners investigate concepts related to data collection and interpretation. They generate all possible outcomes in a beginning study in the realm of statistics. The use of real life situations helps to engage students.
Curated OER
How Much Do I Watch TV?
In this television watching worksheet, learners determine the amount of television they watch in a week by recording the names and times of the shows. They total the number of hours of watching time. You can use this with upper...
Curated OER
Exercise Those Statistics!
Young scholars participate in various activities, measuring their pulse rates and recording the data. They analyze the statistical concepts of mean, median, mode, and histograms using the data from the cardiovascular activities.
Curated OER
Census Statistics and Graphing
Students graphically represent data from the Census. In this middle school mathematics lesson, students investigate the housing characteristics of different tribes of Native Americans and compare them to the average American...
Curated OER
Introduction to Descriptive Statistics with Mode, Median, Mean and Range
Students complete several games and experiments, tally and graph their results. They figure the mean, median, range and/or average of their graphs to describe class results. They consider which statistic best represents the data at hand.
Curated OER
Histograms and Statistical Graphics
In this statistics worksheet, young scholars solve 6 data problems. They construct a histogram of given data, they create a frequency polygon, and a stem and leaf diagram. Students create a dot plot and a pie chart for given data sets....
Curated OER
Solving Genetic Puzzles
Seventh graders examine genetics combination using statistics. In this statistics lesson, 7th graders examine genetic trait using a table or punnett square to identify genotype and phenotype. This assignment requires more than one class...
Curated OER
Mapping River Statistics
High schoolers research different statistics to do with the Mississippi River. They answer questions about finding data and collect it by conducting research. The research is used to construct a data table. Then students use the table to...
Curated OER
Possible Outcomes
For this statistics worksheet, students plot the possible statistical outcomes by examining the data and plotting the missing answer for the four problems.
Curated OER
Understanding Statistics
In this statistics worksheet, students examine and interpret pictographs and line graphs. Students analyze the provided data in order to create bar graphs, circle graphs, and box and whisker plots. The nine page worksheet accompanies a...
Curated OER
How High Are the Clouds?
Students analyze height and collect data to create a graph. In this statistics instructional activity, students use central tendencies to analyze their data and make predictions. They apply concept of statistics to other areas of...
Curated OER
No New Workers Need Apply
Students explore older people's perspectives on work and retirement by creating charts to reflect statistical trends and formulate interview questions. They write follow-up articles that record and comment on the attitudes of their...
Curated OER
Taste the Rainbow
Young scholars practice estimating and graphing by utilizing Skittles. In this statistics instructional activity, students complete worksheets based on the likelihood of a certain color of skittle coming out of the bag. Young...
Curated OER
Word Power
Fifth graders identify a set of data from a real world problem. In this statistics instructional activity, 5th graders identify the range, mode, median and mean using some manipulatives. They write words randomizing the letters.
Other popular searches
- Data, Census, & Statistics
- Probability and Statistics
- Educational Statistics
- Baseball Statistics
- Math Statistics
- Climate Statistics
- Math Lessons Statistics
- Median and Mean Statistics
- Statistics Lesson Plans
- Sports and Statistics
- Probability Statistics
- Black Plague Statistics


