Hi, what do you want to do?
National Council of Teachers of Mathematics
The Math Forum: The Cereal Box Problem
A cereal company is offering six different prizes in their boxes. How many boxes would you expect to have to purchase in order to collect all six prizes? Known as the Cereal Box Problem, this question is explored here. A solution is...
Other
Eduteka: Matematica Interactiva
Topics covered in this site are: concepts of numbers, geometry, algebra and statistics. This site has lesson plans, interactive activities and discussions.
Khan Academy
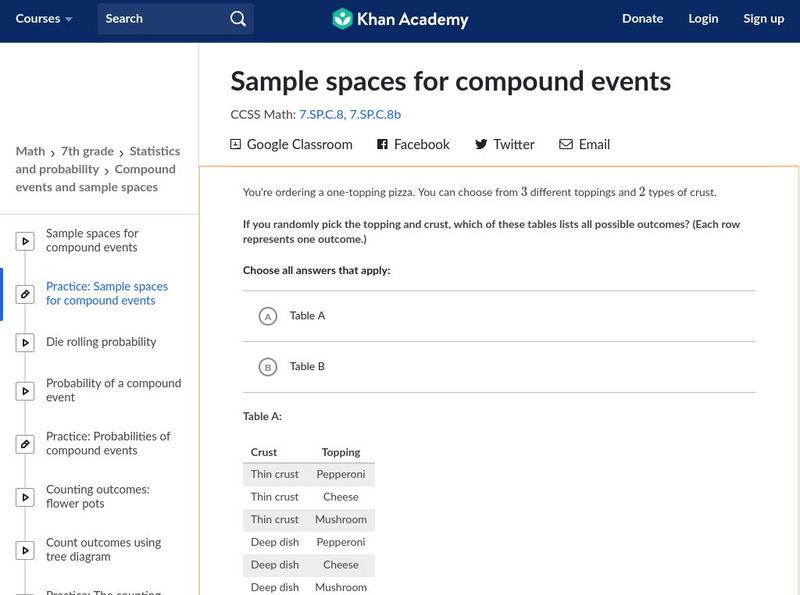
Khan Academy: Sample Spaces for Compound Events
Practice interpreting diagrams and sample spaces to find the probability of outcomes.
Khan Academy
Khan Academy: Simple Hypothesis Testing
Show that you have mastery over the idea behind hypothesis testing by calculating some probabilities and drawing conclusions. Students receive immediate feedback and have the opportunity to try questions repeatedly, watch a video or...
Other
Clayton State: Linear Regression
Introductory look at linear regression. Notes presented in outline form, with key concepts and formulas given. An example is presented at the end.
Khan Academy
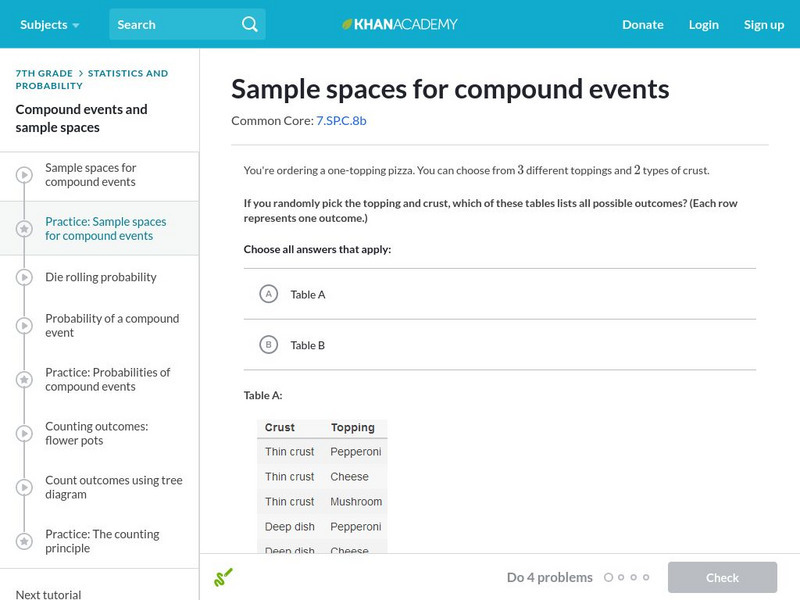
Khan Academy: Sample Spaces for Compound Events
Practice checking if sample space diagrams match a compound event. Students receive immediate feedback and have the opportunity to try questions repeatedly, watch a video or receive hints.
Math Planet
Math Planet: Pre Algebra: Finding the Odds
Discover how to find the odds or chance of an event occurring by taking a look at an example and a video lesson.
Texas Instruments
Texas Instruments: The Normal Distribution
Students graph normal distributions, shade desired areas, and find related probabilities. They graph Normal probability scatter plots to check the normal (linear) shape of a data distribution.
University of Colorado
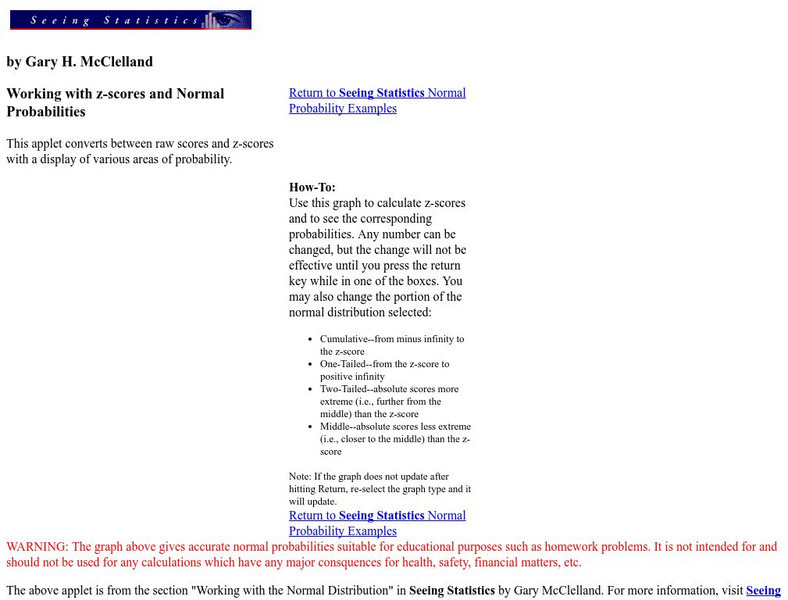
University of Colorado: Z Scores Applet
The Applet assists the user in questions which specify a probability and ask for the relevant range of raw scores or z scores. The program will also transform from raw to z scores and back again, if needed.
Other
West Virginia University: Normal Distribution
The history of the normal curve and its use in statistics is presented. An Applet is provided for the user to adjust the left and right edges of the probability and see the effect on the area under the curve.
Web Center for Social Research Methods
Research Methods Knowledge Base: Sampling in Research
Site discusses the use of sampling in research. The key statistical terms used in sampling are linked for the user to quickly find definitions. The major concepts of probability and nonprobability are also highlighted.
Texas Instruments
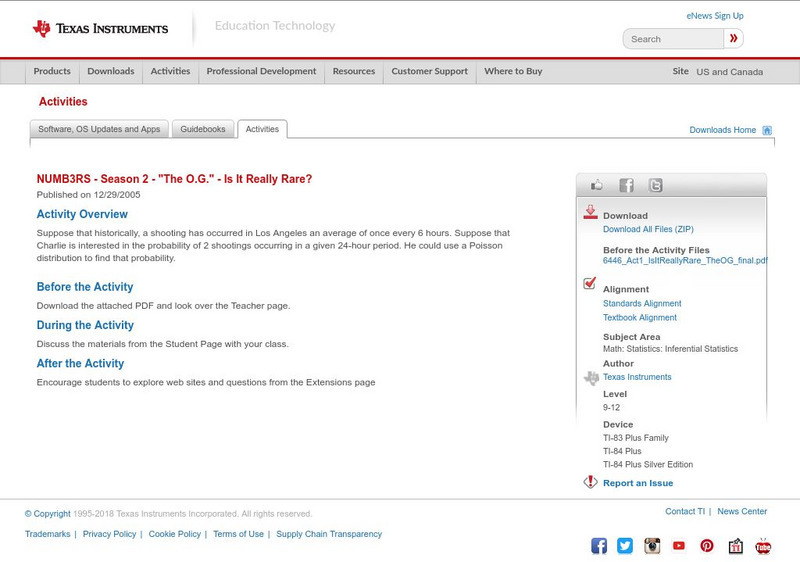
Texas Instruments: Numb3 Rs: Is It Really Rare?
Based off of the hit television show NUMB3RS, this lesson introduces students to the Poisson Distribution to determine the probability of events happening a certain number of times in a given time period. The lesson is framed in the...
Stefan Warner and Steven R. Costenoble
Finite Mathematics & Applied Calculus: Uniform Distribution
Students learn about probability density functions and uniform distributions. The tutorial investigates the statistics concepts through class notes and examples. Review exercises are included.
Palomar Community College District
Palomar College: The Normal Curve an Example
A collection of step-by-step worked problems demonstrating how to take a normal curve and determine the probability (area) under it. Hints are provided along the way and the final measures are shown for the user to check.
Other
Fayetteville State University: Z Distributions
The introductory paragraph explains Z-Distributions, their spread, and the ability to find certain values within the distribution. Two animated graphs are then provided as an example of the probability of the normal distribution curve.
ESPN Internet Ventures
Espn: Billie Jean Won for All Women
Although she won numerous tennis championships, Billie Jean King will probably always be remembered for her victory against Bobby Riggs in the "Battle of the Sexes". Biographical facts and career statistics are included at this ESPN site.
Khan Academy
Khan Academy: Data Inferences Harder Example
This video resource from Khan Academy provides practice questions for the SAT Math. Watch Sal work through a harder Data inferences problem. We make a confidence interval by starting with a sample result and adding and subtracting the...
Famous Scientists
Famous Scientists: Daniel Bernoulli
Read a short biography about Daniel Bernoulli, and find out about his work in fluid mechanics, and his pioneering work in probability and statistics.
Texas Instruments
Texas Instruments: What Are the Chances?
In this activity, students determine the probability of a spinner landing on a certain number in eleven trials. They also learn to change the weightage and find subsequent effect on the probability.
Texas Instruments
Texas Instruments: Numb3 Rs: Is It for Real?
Based off of the hit television show NUMB3RS, this lesson uses sabermetrics (study of statistics of baseball) to try to determine when certain players had "change points," or times when their performance drastically changed. This is done...
Texas Instruments
Texas Instruments: Venn Diagrams
This set contains statistics questions about Venn diagrams. The student interprets when a Venn diagram suggests such event pairs as mutually exclusive, complementary, and independent events, and uses these diagrams in determining...
Texas Instruments
Texas Instruments: Tiles in a Bag
How many tiles would you have to pick to be confident that your estimated probability truly represents the situation? In this activity, you will draw a tile from a bag, record its color and put it back in the bag. The bag contains 24...
Texas Instruments
Texas Instruments: Spin Me Along
Students explore probability and patterns in fractions, decimals, and percents by spinning three spinners and recording and analyzing the results.
Wolfram Research
Wolfram Math World: Matrix
From Mathworld.com as site on Maxtricies. Includes formulas, definitions, and links to related articles.


