Hi, what do you want to do?
Science and Mathematics Initiative for Learning Enhancement (SMILE)
Smile: Stats & Probability Lesson Plans
A collection of elementary lesson plans for the beginning study of statistics. These plans, written by educators, detail the materials needed for the lesson plan and the steps to be followed.
Science Education Resource Center at Carleton College
Serc: An in Class Experiment to Estimate Binomial Probabilities
This hands-on activity is appropriate for a lab or discussion section for an introductory statistics class, with 8 to 40 students. Each student performs a binomial experiment and computes a confidence interval for the true binomial...
Illustrative Mathematics
Illustrative Mathematics: S cp.a.1, S cp.a.4, and S cp.b.6: The Titanic 1
On April 15, 1912, the Titanic struck an iceberg and rapidly sank with only 710 of her 2,204 passengers and crew surviving. Data on survival of passengers are summarized in the table below. (Data source:...
National Council of Teachers of Mathematics
The Math Forum: Prob/stat Classroom Materials
This site provides links to lesson plans, example problems, and software sites for probability and statistics.
TeachEngineering
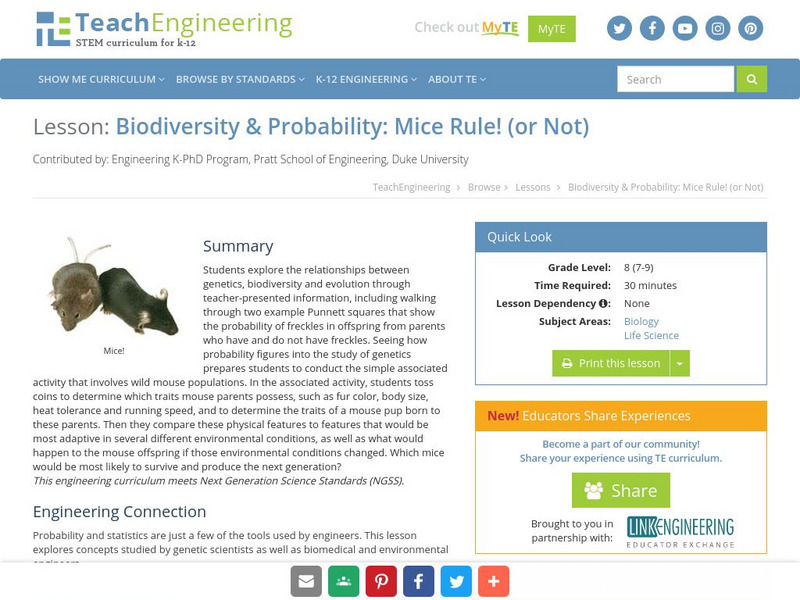
Teach Engineering: Mice Rule! (Or Not)
Students explore the relationships between genetics, biodiversity, and evolution through a simple activity involving hypothetical wild mouse populations. First, students toss coins to determine what traits a set of mouse parents...
Alabama Learning Exchange
Alex: My Peanut Butter Is Better Than Yours!
The students will engage in the process of statistical data comparing data using tables and scatterplots. The students will compare data using measures of center (mean and median) and measures of spread (range). This lesson can be done...
Alabama Learning Exchange
Alex: Let's Make a Pie
The students will survey their classmates and construct circle graphs to display their results. Students will produce circle graphs using a compass and protractor, and then with an interactive computer program.This lesson plan was...
Illustrative Mathematics
Illustrative Mathematics: S Cp Breakfast Before School
On school days, Janelle sometimes eats breakfast and sometimes does not. After studying probability for a few days, Janelle says, "The events 'I eat breakfast' and 'I am late for school' are independent." Explain what this means in terms...
Science Education Resource Center at Carleton College
Serc: Understanding the Standard Deviation: What Makes It Larger or Smaller?
Students develop a better intuitive understanding of what is meant by variability in statistics. Emphasis is placed on the standard deviation as a measure of variability.
National Council of Teachers of Mathematics
The Math Forum: Traffic Jam Activity Lesson Plan
There are seven stepping stones and six people - three on the left facing the three on the right. How is it possible to have the three on the left end up on the right, and vice versa, while everyone was at all times standing on a stone...
Illustrative Mathematics
Illustrative Mathematics: S Id, F if Laptop Battery Charge
This task uses a situation that is familiar to students to solve a problem they probably have all encountered before: How long will it take until an electronic device has a fully charged battery? Given data, students perform a variety of...
University of Colorado
University of Colorado: Discrete Mathematics Project: What're the Odds?
This is an activity that may be instructive when trying to learn the concept of "odds" and how they are found.
PBS
Pbs Teachers: Whirlybirds [Pdf]
Predict and determine the frequency of an event and measure to the nearest centimeter while constructing whirlybirds in a simulation of a parachute jump competition.








![Pbs Teachers: Whirlybirds [Pdf] Lesson Plan Pbs Teachers: Whirlybirds [Pdf] Lesson Plan](https://static.lp.lexp.cloud/images/attachment_defaults/resource/large/FPO-knovation.png)