American Statistical Association
Happy Birthday to . . . Two?
How many people do you need in a room before two likely share the same birthday? Scholars consider this puzzle by analyzing a set of data. They ponder how to divide the data and determine the proper size of a group for this event to...
Curated OER
Olympic Decimals
Add competitive event times, expressed in decimals, to determine the winners! Individuals use a chart showing competitors' times in four events to figure each team's total time and individual standing.
Shodor Education Foundation
From Probability to Combinatorics and Number Theory
What middle schooler does not enjoy an occasional online game? In this lesson play, you will find embedded links to an online probability game, and informative pages about how division is used in probability, the concept of tree models,...
Curated OER
Get the Picture!
Astronomers practice downloading data from a high-energy satellite and translate the data into colored or shaded pixels. As a hands-on activity, they use pennies to simulate high-energy satellite data and they convert their penny...
Curated OER
Sexually Transmitted Diseases, Day 2: HIV/AIDS - Understanding the Disease
One lesson in a series on sexually transmitted diseases, this activity is a good review about HIV/AIDS. Five main points in this lesson direct small groups of learners to read and present their information. They will need to make a...
Curated OER
Linguistic Diversity Secondary
Don't be scared off by the title! Read this information packet with your class, or send them off on their own. After each section, you'll find a series of comprehension questions. Great preparation for state testing!
Curated OER
Healthy Heart Commitment Card
Make a commitment to give up one, just one, unhealthy food or drink. Teachers make a commitment for a month, the youngsters make a commitment for two weeks. The youngsters buddy up to support each other. Do this activity in February,...
Curated OER
Linear Regression and Correlation
Learners explore scatter plots. In this linear regression lesson, groups of pupils graph scatter plots and then find the line of best fit. They identify outliers and explain the correlation. Each group summarizes and shares their...
Curated OER
Mutations and Cancer
Young scholars study how cancer cells mutate and affect cell division. In this investigative lesson students view a PowerPoint presentation learn the seven warning signs of cancer.
Curated OER
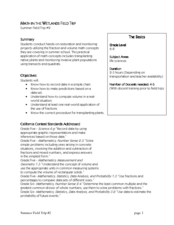
Math in the Wetlands Field Trip
Get your class out in the environment for hands on math activities. In this wetlands lesson, learners transplant native plants, calculate how much soil is needed, and perform math activities based on this experience. They then make...
Curated OER
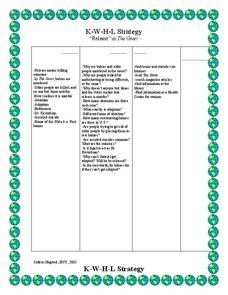
The Giver: K-W-H-L Strategy
Explore the theme of release and death in Lois Lowry's The Giver with a K-W-H-L chart. After noting what they already know, kids come up with a list of questions about topics that they would like to know about, as well as how they...
Shodor Education Foundation
Algorithm Discovery with Venn Diagrams
Here is a lesson that takes an interesting approach to analyzing data using box and whisker plots. By using an applet that dynamically generates Venn diagrams, the class forms a strategy/algorithm for guessing the rule that fits...
Pulitzer Center
Revolution in Tunisia
How much do your pupils really know about the revolution in Tunisia? In order to inform your class and spark discussion, first create a country profile, comparing and contrasting Tunisia with the United States. Learners then analyze the...
EngageNY
Interpreting the Standard Deviation
Does standard deviation work for non-symmetrical distributions, and what does it mean? Through the use of examples, high schoolers determine the standard deviation of a variety of distributions and interpret its...
EngageNY
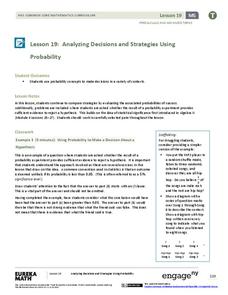
Analyzing Decisions and Strategies Using Probability 2
Explore how to compare and analyze different strategies. In the 20th installment of a 21-part module, scholars continue their analysis of decisions and strategies from the previous instructional activity. They then extend this concept to...
Virginia Department of Education
Quadratic Curve of Best Fit
Class members create a table of the number of chords that can be drawn given the number of points on a circle. Pupils analyze the data created, find a function to fit to it, and use the function to make further predictions.
Virginia Department of Education
Probability
Classes explore different scenarios using manipulatives to learn about the difference between independent and dependent probability. Learners experiment with colored chips to model the two types of probabilities. To test their...
Virginia Department of Education
Scatterplots
Math is all fun and games with this activity! Learners use an activity designed around hula hoops to collect data. They create scatter plots with their data and then analyze the graphs for correlation.
EngageNY
Chance Experiments
Class members are introduced to probability using terms such as impossible, unlikely, likely, and certain. Numbers between zero and one are associated with the descriptions of probability. Pupils find the likelihood of chance experiments...
Virginia Department of Education
Linear Curve of Best Fit
Is foot length to forearm length a linear association? The class collects data of fellow scholars' foot length and the length of their forearms. They plot the data and find a line of best fit. Using that line, they make predictions of...
Virginia Department of Education
Types of Variations
Scholars determine how two quantities vary with respect to each other. They complete a fill-in-the-blank activity by stating whether the entities vary directly, inversely, or jointly, create equations that match different variations, and...
Virginia Department of Education
Calculating Measures of Dispersion
Double the fun — calculate two measures of deviation. The lesson plan provides information to lead the class through the process of calculating the mean absolute deviation and the standard deviation of a data set. After learning how to...
Virginia Department of Education
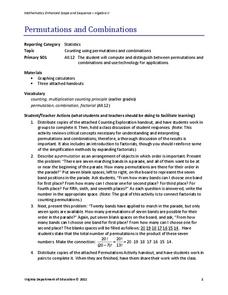
Permutations and Combinations
Counting is not all it adds up to be — sometimes it involves multiplying. The lesson introduces permutations and combinations as ways of counting, depending upon whether order is important. Pupils learn about factorials and the formulas...
Virginia Department of Education
Graphs
Examine different types of graphs as a means for analyzing data. Math scholars identify the type of graph from a series of data displays and then develop questions to match each one. Then, given a scatter plot of height versus age...
Other popular searches
- Data, Census, & Statistics
- Probability and Statistics
- Educational Statistics
- Baseball Statistics
- Math Statistics
- Climate Statistics
- Math Lessons Statistics
- Median and Mean Statistics
- Statistics Lesson Plans
- Sports and Statistics
- Probability Statistics
- Black Plague Statistics

