Curated OER
Algebra: Olympic Races
Students use Olympic athlete statistics to make algebraic calculations. In this algebraic equation lesson, students use algebra to calculate athlete speed and calories burned.
Curated OER
Potato Ways
Students analyze the packaging process. In this consumer awareness instructional activity, students analyze the process of packaging a potato and identify positive and negative ways of packaging. Students study statistics on an overhead...
Curated OER
Pick Up a Litter Bit-Earth Day
Students investigate the effects of litter on the environment. In this environmental lesson, students read the statistics on pollution and identify the effects it has on the Earth. Students develop a plan to clean up their local community.
Curated OER
A State of Obesity
Students compare obesity trends between states. In this health studies lesson plan, students conduct research to compare and contrast obesity trends from state to state. Students view a PowerPoint presentation to determine...
Curated OER
!-Survey Project
Young scholars explore the process of the production of statistical information. In this statistical analysis lesson, students design, process and report on a survey of their own creation. ...
Curated OER
The Challenge of School Violence
Students examine school violence. In this school violence lesson, students listen to a teacher-led lecture regarding statistics and studies about school violence. Students discuss ways to deter school violence and participate in a school...
Curated OER
America's Heartland
Students complete geography and trade activities about global trade. In this geography and trade lesson plan, students read information to learn about absolute advantage, comparative advantage, trade factors, U.S. trade partners, and...
Curated OER
Fractions: Jewish Population of Europe during WWII
Students evaluate population maps and convert fractions to percentages. In this WWII lesson, students use statistics on the Holocaust to determine population loss and change. Students create their own math questions and answers using the...
Curated OER
What's in the Bag?
Students calculate the probability of an event occurring. In this statistics instructional activity, students calculate the outcome using combination and permutation. They differentiate between-theoretical and experimental probability.
Curated OER
Probability- Many Stage Experiments
Learners list the sample space of an experiment. In this statistics lesson, students calculate the number of favorable outcome in a given sample space. They define and apply mutually exclusive events versus not mutually exclusive events.
Curated OER
Water Shortages
Learners explore natural elements by participating in a bingo activity. For this water usage lesson, students discuss the importance of clean water and complete worksheets based on water shortage statistics. Learners utilize flashcards...
Curated OER
The Great Race
Students identify the mean, median and mode of collected data. For this statistics lesson, students collect, graph and analyze data using central tendencies. They work in groups to collect data on a robot through an obstacle course.
Curated OER
String Of Lights
Students collect, graph and analyze data. In this statistics lesson, students compare data using different types of graphs. They make predictions, draw conjectures as they analyze bulbs used in a holiday light set.
Curated OER
Class Ketchup
Students describe statistics by conducting a class cooking activity. In this ketchup lesson, students conduct a class survey based on ketchup consumption habits by students. Students utilize tomatoes, water and a bottle to create their...
Curated OER
Skateboard Flex
Middle schoolers examine statistics by completing a skateboard measuring activity. In this flex lesson, students define what skateboard "flex" refers to and identify the proper method of measuring flex by conducting an experiment with...
Curated OER
Details, Details
Learners explore statistics by participating in a personal details activity. For this data collection lesson, students identify the importance of personal information collection and how it can be used against them if collected illegally....
Curated OER
Making A Colorado Brochure
Pupils create a Colorado brochure. Given a variety of brochures, students explore the aspects of an attractive brochure. In groups, pupils explore tourist attractions, important people, major cities, and statistics of Colorado. ...
Curated OER
Mean, median, and mode... Use the data
Ninth graders participate in a lesson focused on the concept of basic statistics. They find the mean, median, and mode of different data sets. More advanced students could practice creating a bell curve from the data.
Curated OER
Health Education: An Integrated Approach; Unintentional Injuries
Third graders identify methods for preventing common injuries. In this injury prevention lesson, 3rd graders first study cartoons of injuries occurring, then write down their thoughts on these images. Next, the teacher shares many...
Curated OER
The Fruits of Fairness
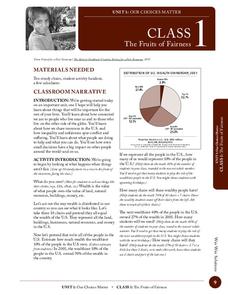
Students examine the distribution of wealth in the US. In this economic distribution lesson, students use math skills to apply real statistics to the students in their classroom making these facts more of a reality.
Curated OER
Form an Opinion-Cats
Pupils discuss which animal makes a better pet. In this statistics instructional activity, students examine the factors that cause people to choose one animal over the other (cat or dog). Pupils discuss their own opinions,...
Pennsylvania Department of Education
Equally Likely and Unequally Likely Outcomes
Students explore probability. In this statistics/probability lesson plan, students compare experimental and theoretical probability and use experimental probability to make predictions and conjectures. Students explore the...
Curated OER
Lesson Plan: The Math of Removal
Students consider the plight of those who walked the Trial of Tears. In this Indian Removal lesson, students compare statistics regarding Indian survival rates.
Curated OER
The Lesson: Kenya
Students consider how recent historical events have impacted Kenya. In this global studies lesson, students visit selected websites to discover information about President Mwai Kibaki, Kenya's statistics, and Swahili. Students share...
Other popular searches
- Data, Census, & Statistics
- Probability and Statistics
- Educational Statistics
- Baseball Statistics
- Math Statistics
- Climate Statistics
- Math Lessons Statistics
- Median and Mean Statistics
- Statistics Lesson Plans
- Sports and Statistics
- Probability Statistics
- Black Plague Statistics


