Curated OER
Diversity of Languages
Students interpret graphs and statistics to recognise and understand the cultural and linguistic diversity of Australia. They create a profile of the linguistic diversity of the class or school. Students discuss Australia's cultural...
Curated OER
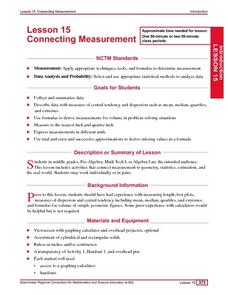
Connecting Measurement
Students participate in activities the connect measurement to geometry, statistics, estimation, and the real world. They collect measurements from their elbow to the tip of their middle finger and make a box plot of the data as well as...
Curated OER
Bullying Essay
In this bullying essay worksheet, students find statistics on the internet about bullying and write an essay about their findings or write a letter to the principle explaining what should be done about bullying.
Curated OER
National Longitudinal Survey of Children and Youth (NLSCY)
Students review data analysis techniques. For this statistics lesson, students access statistical software regarding the National Longitudinal Survey of Children and Youth. Students read and interpret the data as they complete the...
Curated OER
Causes of School Violence
Students examine school violence. In this school violence lesson, students listen to a teacher-led lecture regarding statistics and studies about school violence. Students discuss bullying and school violence.
Curated OER
Exploring Gender Bias in the Workplace
Students investigate gender bias in the work place. In this secondary mathematics lesson plan, students gather research on the current statistics about a profession which focuses on the female//male ratios and the pay scale of the...
Curated OER
Corrupted Politicians
Students solve problems using statistics and probability. In this math lesson, students analyze how many corrupted members there are in a fictional town council. They give real life examples where statistics and probability can be used.
Curated OER
Hare and Tortoise Game
Students participate in the Hare and Tortoise Game and the "Castle Warwick" problem (from an Addison Wesley text). They use the computer to practice resampling statistics and explore different approaches to their tasks. They present th
Curated OER
The Winning Edge: Probability in Basketball: Lesson 2
Students calculate the probability of a desired outcome based upon a statistically significant number of discrete events (i.e. endgame free-throw attempts). They participate in an online simulation of basketball free throws.
Curated OER
To Protect and Serve
Students explore race issues that exist in the police force and in police actions through sharing opinions and researching and presenting related statistical and historical information.
Curated OER
Population Policy-Progress Since Cairo
Students survey the evolution of population policies. They assess the presence of gender-bias in development statistics. They evaluate the nexus of women, development, and population policy.
Curated OER
Earth Day Trash Survey Unit
Students participate in local Earth Day activities. They keep track of the types of trash they pick up. They aggregate their data to develop whole-class statistics of what they found.
Curated OER
Probability and Sports
Students research topics on the internet where probability is relevant. Students study statistics and probability concepts by looking at practical questions that arise in professional sports.
Curated OER
Immigrant Photo Analysis
Students examine photographs taken of immigrants during late 1800s and early 1990s in America, and identify factors involved in immigration through examination of primary documents that include statistics, trends, graphs, photographs,...
Curated OER
Integration and the "Barrier Breakers": Black Baseball 1945-1960
Learners explore integration of Major League Baseball, identify important individual baseball players who played key roles in integration, and analyze historical information through charts, graphs, and statistics.
Curated OER
Save the _____ Story Board
Students research an endangered species. They examine statistics, characteristics, and information about the species. Students play "webmaster" and design a site that will help to save an endangered species.
Curated OER
Mean, Median, and Mode
Students calculate measures of central tendency. in this mean, median, and mode lesson, students calculate the measures of central tendency. They organize data, examine and explain the statistics.
Curated OER
Do Vampires Really Exist?
Pupils identify and extend a number pattern into very large values. They create and interpret a graph based on their number patterns. Students compare a math model with real-world statistics about the existence of vampires.
Curated OER
Calculating Buttons
Students, after reading "The Button Box" by Margarette S. Reid, analyze real-world data by surveying a sample space. They predict the generalization onto a larger population utilizing calculators and computers. Students total categories,...
Curated OER
Data Collection
Students explore the reason for collecting and analyzing facts and figures or data and statistics. They show how data can be used to help us to solve real life problems and plan for the future. Students use everyday problems that can be...
Curated OER
Choose or Lose: The Electoral Process
Learners examine the local and national election process. In groups, they brainstorm a list of the issues important to them and compare them to an overall list of issues present in the election. They analyze graphs and complete...
Curated OER
The Ultimate Sacrifice
Students explore the concept of sacrifice during wartime. In this World War II lesson, students explore the Allied and Axis Powers that existed during the war. Students discover sacrifices that were made by both powers during the war as...
Curated OER
Alleviating Poverty
Students explore the prevalence of poverty. In this global studies lesson, students participate in a budgeting simulation. Students also research world poverty statistics and discuss the social issue....
Curated OER
Television: Comedy Vs. Drama
Students investigate the world of Television by contrasting specific programs. In this visual storytelling lesson, students compare and contrast the differences between comedy and drama by making a Venn Diagram. Students...
Other popular searches
- Data, Census, & Statistics
- Probability and Statistics
- Educational Statistics
- Baseball Statistics
- Math Statistics
- Climate Statistics
- Math Lessons Statistics
- Median and Mean Statistics
- Statistics Lesson Plans
- Sports and Statistics
- Probability Statistics
- Black Plague Statistics

