Curated OER
The Football and Braking Distance: Model Data with Quadratic Functions
Students engage in a lesson that is about the concept of data analysis with the use of quadratics. They use a Precalculus text in order to give guidance for independent practice and to serve as a source for the teacher to use. The data...
Curated OER
Sampling Distribution and Estimators Section 6.4
In this distribution worksheet, students examine given situations, determine the probability of an event, identify the standard deviation, and find a specified percentile and quartiles. Five probability story problems are available on...
Curated OER
Hypothesis Testing: Claim on Mean; Population Standard Deviation Known
For this standard deviation worksheet, students are given statistical data in a story problem. They use a level of significance to test the claim given by the data. This worksheet contains three problems.
Curated OER
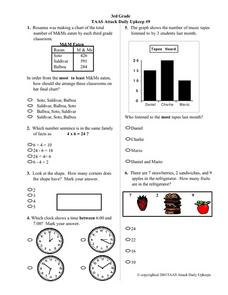
3rd Grade TAAS Attack Daily Upkeep #9
In this math literacy worksheet, 4th graders practice interpreting the pictographs in order to assemble the information to find the solutions to the 13 problems.
Curated OER
"M&Ms"® Candies Worksheet 1
In this math worksheet, students find the likelihood of different outcomes with the use of M and M's candy for the seven questions and fill in the graphic organizer.
Curated OER
Possible Outcomes 6
For this math worksheet, 6th graders make predictions of the possible outcomes using the data taken from two word problems. The answers are chosen from the outcomes that are possible using the multiple choice format.
Curated OER
Possible Outcomes
In this math literacy worksheet, 6th graders are given one word problem using the data of making slushies and then choose from the possible combinations of flavors.
Curated OER
Probability
For this math literacy worksheet, pupils solve the four problems related to the concept of probability using the multiple choice format.
Curated OER
Coyote Cafe
In this math worksheet, learners read the word problems and write down the possibilities of possible servings. The outcomes are plotted using a graphic organizer.
Curated OER
Stem and Leaf Plots
In this math worksheet, students organize data into stem and leaf plots. They select the correct stem to use to organize the data. Students analyze the data on a given stem and leaf plot.
Curated OER
Data Analysis, Probability, and Statistics: Exploring Websites
Students measure their pulse rates and place the number on the board. They arrange the numbers in order and discuss the differences between isolated facts and data. Students explore websites that relate to data analysis and report their...
Curated OER
Box Plots on the TI-83 Calculator
Eighth graders research box plots on the Internet. They gather real life statistics and analyze the collected statistics by making multiple box plots on the TI-83 calculator.
Curated OER
Math: Football Fever Fun
Students compile statistics from high school or other football team and construct a spreadsheet on which to record their findings. Using Chart Wizard to analyze the data, they construct charts and graphs for a visual display of the...
Curated OER
It All Adds Up
Students brainstorm reasons for politicians to expand recycling programs and find statistics to support recycling programs. They design posters, displaying a compelling statistic about recycling, to convince students at their school to...
National First Ladies' Library
Let's Make a World Series Almanac
Middle schoolers discuss the meaning of the word, almanac and then decide which statistics about the World Series they think should be included in the almanac, browsing some websites to get some idea of what statistics are available....
Curated OER
6-8 Baseball Fun: Percentages, Decimals, and Fractions
Young scholars practice the concepts behind fractions, decimals, and percents by using sports statistics on baseball cards. In this baseball math lesson, students use fractions and estimation to calculate statistics. Young scholars...
Curated OER
Dynamic Data Range, Mode, and Median
Pupils practice statistics skills by calculating range, mode, and median. In this 4th - 6th grade lesson plan, students calculate range, median, and mode of given numbers while playing a game.
Curated OER
Acid Rain Simulation
Young scholars collect data on causes of Acid Rain. In this science lesson, students simulate the effects that produce acid rain, collect and analyze data from their samples. They relate science and statistics in this lesson.
Curated OER
Graphing in the Information Age
Middle schoolers create a variety of graphs based on population data. In this statistics lesson, students use data that can be gathered on-line to make a bar chart, line graph, and circle graph.
Curated OER
Sinusoidal modelling of Canad'a youth cohorts
Students explore the general form of the sine equation. In this trigonometry lesson, students explore the relationship between the changing parameters and the graph of the sine equation. Students use data and a statistical...
Curated OER
The Rights of Bike Riders
Students write a letter to the editor of a newspaper about the bicycle helmet safety issue. They gather statistics about bicycle helmet use and discuss the statistics as a class and explain how to interpret the numbers accurately. They...
Curated OER
Meaning of Alpha
learners define the alpha level. In this statistics lesson, students identify what makes the "null rejected" and discuss the data surrounding the null. They observe the meaning of alpha as it relates to the bell curve.
Curated OER
Corrupted Politicians
Students solve problems using statistics and probability. In this math lesson, students analyze how many corrupted members there are in a fictional town council. They give real life examples where statistics and probability can be used.
Curated OER
The Geography of Tornadoes OR
Students learn some basic facts about tornadoes and map two selected tornado statistics by state, and observe, analyze and speculate about the pattern(s) created by the completed map.
Other popular searches
- Data, Census, & Statistics
- Probability and Statistics
- Educational Statistics
- Baseball Statistics
- Math Statistics
- Climate Statistics
- Math Lessons Statistics
- Median and Mean Statistics
- Statistics Lesson Plans
- Sports and Statistics
- Probability Statistics
- Black Plague Statistics


