Curated OER
Integrated Algebra
In this algebra worksheet, students review a variety of math concepts as related to algebra. They solve problems on statistics, factoring and solving equations. There are problems involving geometric formulas and shapes.
Curated OER
Rural-Urban Migration in the 1990's
Students consider the reasons why people relocate from one area to another. For this relocation lesson, students read an article that includes research and statistics on which age, education level, etc., of the population moves the...
Curated OER
Mean Meadian and Mode
Students apply central tendencies to given data. In this statistics lesson, students calculate the mean, median, and mode as it relates to their data. They collect data and graph it while identifying the way the numbers are ordered.
Curated OER
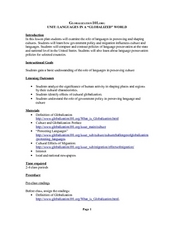
Languages in a Globalized World
Students explore language changes that may occur in a globalized world. In this language lesson plan, students read the linked articles about globalization and the protection of languages. Students also examine statistics and conduct...
Scholastic
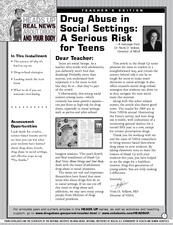
Drug Abuse in Social Settings: A Serious Task for Teens
Students discuss why drug abuse risk is higher in social settings. In this health science lesson, students interpret real life statistics on teen drug use. They describe refusal and prevention strategies.
Curated OER
Mathematics Lesson for Grade 12
Twelfth graders examine multiple aspects of statistics. In this mathematical reasoning lesson, 12th graders solve problems on probability, logarithms, exponential relationships and transforming rectilinear shapes. This resource contains...
Curated OER
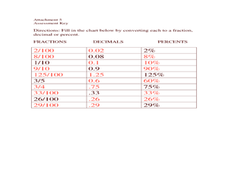
Convert among decimals, fractions, and percents
Seventh graders convert among decimals, percents, and fraction with and without a calculator. In this seventh grade mathematics lesson, 7th graders explore strategies that help them to remember how to perform the needed operation...
Curated OER
The Monty Hall Problem
Students define and differentiate between experimental and theoretical probability. In this statistic lesson, students play the game "Monty Hall" and use probability to come up with the best strategies to play the game.
Pennsylvania Department of Education
Equal Groups
Students explore statistics by completing a graphing activity. In this data analysis activity, students define a list of mathematical vocabulary terms before unpacking a box of raisins. Students utilize the raisins to plot data on a line...
Curated OER
A Rewarding Endeavor
Students develop a survey to find out if people would return an envelope of money they found. Include options for giving it to the police, advertising for the one who lost it. Students place their research in a feature article that...
Curated OER
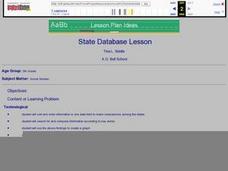
State Database Lesson
Fifth graders create a database about the geography of the United States. The access to a computer is essential for this lesson plan. The outcome is that technology is used as a tool to measure student understanding of geographical...
Facing History and Ourselves
The Importance of a Free Press
"Congress shall make no law . . . abridging the freedom of speech, or of the press;. . ." Why is this guarantee of free speech and a free press the First Amendment to the US Constitution? Why are these rights so essential to a...
Smithsonian Institution
Changing Gender Roles on the Home Front
Many historians discuss how gender roles changed because of World War II, but how did this come to be? An informative resource challenges scholars to do some digging and research the information for themselves. They research how...
Curated OER
Give Me Your Vital Statistics
Students get to know each other and while giving them an opportunity to practice their logical thinking skills.
Curated OER
A Statistical Study on the Letters of the Alphabet
Students use a book or magazine to research the use of letters. They complete a worksheet and compare their results.
Curated OER
Cruise Conditions Graphing & Statistics
Students monitor weather conditions for an eighteen day period at a specific location. The temperature of both air and water is taken and the mean, median, and mode calculated. Differences between the highest and lowest recordings are made.
Curated OER
Tech Algebra: A Statistics Study
Students use the internet to gather a minimum of thirty pieces of data. Students create box and whisker graphs, and stem and leaf plots from the information. They calculate mean, median, mode, and range. Students write a summary and...
Curated OER
Sculptural Statistics
Students conduct an experiment to determine the frequency of pulling various parts of an ancient Greek sculpture out of a hat.
Curated OER
Statistical Accuracy and Reliability
Ninth graders assess the accuracy and reliability of current survey data and how it is represented. They design a survey, collect data, and use technology to analyze the data and present the results. Students examine scatter plots and...
Curated OER
The Birthday Problem
Students try to solve the birthday problem: Given a group of people, what is the probability of two people in the group having the same birthday?
Curated OER
Rolling For Value
Learners participate in a instructional activity to comprehend the concept of probability while rolling dice. They recognize patterns while making observations and recording the data for each roll. Students also review place values while...
Curated OER
Population Growth
Students investigate the biodiversity of living things and how they are interdependent upon each other. They conduct research using a variety of resources. Specifically students create a graph to show how a population can grow in an...
Curated OER
Displaying The Data
Students engage in a research project to find information about one's personal family heritage. They collect information by conducting family interviews. Students use the data to create a graph, map, and timeline. Then students take part...
Curated OER
Water Survey
Students investigate water usage for the average home with the help of conducting a home survey. The information is collected and organized into a graphic format. Then they analyze the results to formulate an educated opinion about water...
Other popular searches
- Data, Census, & Statistics
- Probability and Statistics
- Educational Statistics
- Baseball Statistics
- Math Statistics
- Climate Statistics
- Math Lessons Statistics
- Median and Mean Statistics
- Statistics Lesson Plans
- Sports and Statistics
- Probability Statistics
- Black Plague Statistics


