Curated OER
When Marriage is a Crime
Students compare and contrast forced marriages with arranged marriages. For this current events lesson, students examine legislation regarding forced marriages and then debate the forced marriage law in Britain.
Curated OER
The Survey Says
Students experience the development of statistical data. In groups, they construct a survey questionnaire for a target audience. Students produce the questionnaire, distribute it, collect it, and tabulate the data. Using EXCEL, the...
Curated OER
Education for Global Peace
Learners survey the class and graph the results. In this graphing and data collection lesson, students conduct a survey to see where their shirts were produced. Individuals use software to graph the results and create a written...
Curated OER
Candy Colors: Figuring the Mean, Median, and Mode
Students count candy by color and then calculate mean, median, and mode. They count candy and use the data to calculate mean, median, and mode (by color) and apply their learning to another collection of data.
Curated OER
Graphing Population Around the World
Students define specific vocabulary necessary for understanding population data. They collect, analyze, and interpret specific data. They utilize computer programs in order to create graphs of collected data.
Curated OER
Probability and Sports
Students explore the concept of probability in sports. In this probability in sports lesson, students research a sport that they enjoy. Students find probability information related to their sport. Students share their findings with the...
Curated OER
Tallest Stack Wins
Young scholars build a stack of pennies as tall as possible, recording the number of pennies they are able to stack before the tower falls. Then, sharing answers, they determine the average number of pennies that could be stacked.
Curated OER
Bias Sampling
Young scholars demonstrate how the results of a poll or other scientific study can be biased by selecting special types of people to respond or by asking only certain questions.
Curated OER
Popcorn Nutrition
Students read a snack nutrition chart and answer questions. They compare nutrition levels of snack foods. They correctly calculate differences in nutritional value.
Curated OER
Graphing Made Easy
Fourth graders discover the appropriate way to construct and analyze bar, line, picto, and circle graphs. They set up frequency tables and perform some statistical analysis (mean, median, and mode) on their data.
Curated OER
Party, Party, Party
Second graders conduct investigations with counting, comparing, organizing, analyzing, displaying and interpreting data. They pose questions for investigation and collect the data. Students display the data in tally charts, uniform...
Curated OER
Analysis of Grooming Behavior in Drosophila melanogaster
Students engage in a lab that focuses on animal behavior in an open ended inquiry based laboratory experience. They build an ethogram, display a transition matrix and analyze a Markov Chain. They remove wings from the drosophila and...
Curated OER
Let's Take a Chance!
Students investigate probability and the chance of an even happening. In this algebra lesson, students incorporate their knowledge of probability to solve problems and relate it to the real world. They learn to make decisions based on data.
Curated OER
Great Tasting Shapes
Fifth graders investigate the concept of median, mode, and range using a simple model for display purposes. They examine different shaped crackers out of a box and identify the ones that occur the most. Then the calculations for the...
Curated OER
Getting A Grip On Graphs
Fourth graders investigate the concept of graphing and comparing different types of data using pictographs, line graphs, scatter plots, etc... They gather data and make interpretations while examining the medium of how it is displayed.
Curated OER
Embracing Diversity
Students explore and use different computer programs for collecting data. For this technology based lesson, students set up a survey and use the Excel and Lotus software to collect data.
Curated OER
How does Your Province Stack Up?
Students investigate data about age, and sex of a population. For this statistics lesson, students are given data on a population to analyze and compare to other provinces. This assignment is part of a geography lesson and requires 3...
Curated OER
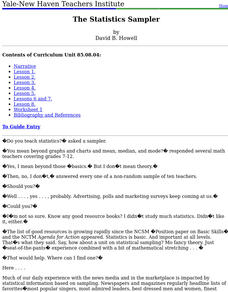
The Statistics Sampler
Learners define sample, describe a random sample, and discuss what compromises a sample. They determine a sample size to estimate a population characteristic with confidence.
Curated OER
Snowfall Statistics for Snowboarding
Students use the Internet to collect the current daily snowfall amounts and also to find the price of a lift ticket for snowboarding at different ski resorts in the United States.
Curated OER
Statistics: Reading and interpreting production graphs
Students interpret and create different types of graphs. They analyze data from charts, develop a survey and design appropriate graphic illustrations and make a presentation.
Curated OER
Global Statistics
Young scholars select appropriate data to determine the mean, median, mode and range of a set of data. They calculate the statistical data on literacy rates and life expectancy within each geographic region of the world. Students...
Curated OER
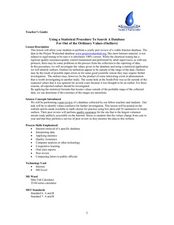
Using a Statistical Procedure To Search A Database For Out of the Ordinary Values
Students develop a spreadsheet containing formulas and find summaries for them. In this investigative lesson plan students choose a topic, investigate it and use MS Excel to sort data.
Curated OER
Statistical Pictures of School and Life
Students explore how mathematical data is used to summarize and illustrate everyday life. They apply mathematical concepts and skills to analyze data. Students conduct a five question survey of 50 people or more and graph the data.
Curated OER
Integration: Statistics, Scatter Plots and Best-Fit Lines
In this math worksheet, students identify the type (if any) of correlation on 6 scatter plots. They use information given on a table to create a scatter plot and identify the type of correlation. Students use the scatter plot to make...
Other popular searches
- Data, Census, & Statistics
- Probability and Statistics
- Educational Statistics
- Baseball Statistics
- Math Statistics
- Climate Statistics
- Math Lessons Statistics
- Median and Mean Statistics
- Statistics Lesson Plans
- Sports and Statistics
- Probability Statistics
- Black Plague Statistics


