Curated OER
"Data Dabble"
Students engage in a lesson which facilitates their use of web sites to find data, graph it, and interpret it, thus scaffolding graphing skills to prepare students for their 8th grade I-search exit project.
Curated OER
Excel Lesson Plan Coin Statistics
Second graders determine the difference between making a prediction and determining actual information. They design a spreadsheet for a coin flipping activity on which they include their predictions and what actual happens when they flip...
Curated OER
Keypals and You
Students collect and compare data received from keypals. They use electronic mail to exchange information with keypals and rrite a paper comparing similarities and differences between themselves and their keypals. In addition, use a...
Curated OER
Don't Settle for a Byte... Get the Megabyte on Technology
Young scholars use word processing, presentation, and spreadsheet software. In this multi-day computer software usage lesson, students complete a research project that requires the use of a word processor, Excel, FrontPage, and...
Curated OER
Coin Count & Classification
Students make a prediction about how 100 pennies sort by decade or year and then test their predictions. They organize their data using a graph that is imbedded in this lesson.
Curated OER
And the Winner Is...
Third graders participate in an election project. They collect data to create a spreadsheet from which a graph is generated.
Curated OER
"Favorite Fairy Tale Characters"
Third graders enter the results of their survey on a spreadsheet. They construct a bar graph showing the results.
Curated OER
Sea Surface Temperature Trends of the Gulf Stream
Students explore the importance of the Gulf Stream. Using a NASA satellite images, they examine the sea surface temperature. Students collect the temperature at various locations and times. Using spreadsheet technology, they graph the...
Curated OER
Bones and Math
students identify and explore the connection between math and the bones of the human body. Students collect data about bones from their classmates and from adults, apply formulas that relate this data to a person's height, and organize...
Curated OER
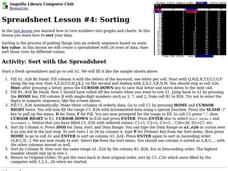
Sorting
Students examine how sorting is the process of putting things into an orderly sequence based on some key value. For this lesson students create a spreadsheet with 26 rows of data, then sort those rows by different values.
Curated OER
Trends in Precipitation
Eighth graders study about precipitation and graph the information. They look for patterns in a scatter graph and make inferences based on what they see. They need to see a relationship between location and the amount of precipitation.
Curated OER
What Color Are Your Skittles?
Students create spreadsheets and manipulate data. They collect data, create appropriate graphs and use percentages to describe quantities. Students compare and contrast data. They use spreadsheets to generate a pie chart.
Curated OER
Let's Keep Track of Grades
Students participate in a technology project. This lesson is a hands-on spreadsheet project where students are responsible for keeping track of their grades for class. The students learn to enter data into a spreadsheet, create...
Curated OER
Time Management
Students plot activities for a 24 hour day. They record their information on a spread sheet program. Students list categories they use and write equations for cells that add cells of each category together. Students create a pie chart of...
Curated OER
Pumped Up Gas Prices
Students calculate gas prices. In this transportation lesson, students tally the mileage and gas costs of their car for one months. They figure out how much was spent on gas and create a graph showing average gas prices over time.
Curated OER
Dinosaur Scavenger Hunt
Students conduct research on dinosaurs and graph the information gathered using a spreadsheet program. In pairs they complete an Internet scavenger hunt, and record five facts about dinosaurs in their science journal.
Curated OER
The Big Hand Challenge
Students utilize a computer spreadsheet to record and analyze data. In this problem solving lesson, students compare their hand size to that of the principal. Students understand standard and nonstandard measurement.
Curated OER
The Effects of Meteor Impacts
Learners investigate meteor impacts on the Earth's surface by using different size balls and charting their impacts, given their diameter and mass.
Curated OER
Candy Bar Survey
Second graders investigate the skill of graphing data by using candy bars to create context for the lesson. They use technology for graphing and organizing information like a spreadsheet. The lesson includes a resource link to aid in the...
Curated OER
Education for Global Peace
Students survey the class and graph the results. In this graphing and data collection lesson, students conduct a survey to see where their shirts were produced. Individuals use software to graph the results and create a written...
Curated OER
Unit 2: Lesson 7
Students are introduced to spreadsheets. They conduct a survey of television viewing time of different shows based on different age categories. Students work in small groups. They collect, data and interpret the data from a survey.
Curated OER
Integration and the "Barrier Breakers": Black Baseball 1945-1960
Young scholars explore integration of Major League Baseball, identify important individual baseball players who played key roles in integration, and analyze historical information through charts, graphs, and statistics.
Curated OER
Macbeth Madness
Young scholars research Macbeth online and complete computer and graphing activities for the play. In this Macbeth activities lesson, students research Macbeth and bookmark the URL's. Young scholars complete activities for the topic on...
Curated OER
Snow Cover By Latitude
Learners create graphs comparing the amount of snow cover along selected latitudes using data sets from a NASA website. They create a spreadsheet and a bar graph on the computer, and analyze the data.


