Curated OER
Data Handling
For this data handling worksheet, 6th graders solve and complete 4 various types of problems. First, they draw a bar chart to represent the information provided in the table shown. Then, students show beneath the table how to work out...
Curated OER
What Are We Listening To?
Students gather data from a web site on number of music albums sold by genre for the last two years. They convert these figures to fractions, decimals, and percents, and display the results in bar graphs and pie charts.
Curated OER
Charting Seasonal Changes
Students research the Earth's patterns of rotation and revolution, create a chart and graph of these patterns and use them to explain the causes of night and day and summer and winter.
Curated OER
T-Shirt Lettering
Students determine the cost of a t-shirt using a variety of mathematical operations to solve problems. Then they use a spreadsheet to calculate the cost of lettering a t-shirt and display this information in a graph.
Curated OER
Weather
Students create a spreadsheet and chart using data collected. In this weather lesson, students select five cities from their state, including the city they live in. Students take daily temperature readings from all five cities. ...
Curated OER
Watch Me Grow
Learners observe that plants need air, food, light, and water to survive. In this plant biology instructional activity, students observe the growth and development of two plants, one is the control plant and the other is denied either...
Curated OER
Microsoft Office Excel
Middle schoolers use Microsoft Office Excel. In this technology lesson plan, students enter data on a spreadsheet using Excel. This programs tallies data and presents it using graphs.
Curated OER
Technology Integration Lesson Plan: Civil War Spreadsheet
Eighth graders discuss and analyze Civil War data, manually graph data on handout, work with partners to enter data into spreadsheets, and create charts on spreadsheet for each data set.
Curated OER
Virtual Field Trip / Route, Mileage and Gasoline Cost Graphs
Young scholars use a spreadsheet program to graph and compare milage, gasoline costs and travel time for two travel routes in their virtual field trip in Michigan. They determine the most economical route based on the graphs and...
Curated OER
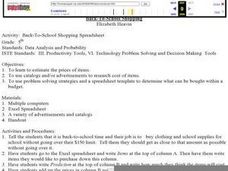
Back-To-School Shopping
Fifth graders estimate the prices of items to be bought for back to school. They use catalogs and/or advertisements to research the cost of each of the items. They use problem solving strategies and a spreadsheet template to determine...
Curated OER
Discovering Pi
Define terminology related to a circle. Practice accuracy in measuring and then create a spreadsheet based on data collected from solving for parts of a circle. Groups can have fun analyzing their data as it relates to Pi.
Curated OER
Historical Population Changes in the US
Students conduct research on historical population changes in the U.S. They conduct Internet research on the Historical Census Data Browser, create a bar graph and data table using a spreadsheet program, and display and interpret their...
Curated OER
Introduction to the National Debt
Students relate the national debt to the economy. In this algebra lesson, students discuss what the national debt is, create a national budget based on priority and what the government should spend money on. They analyze their findings...
Curated OER
Pizza! Pizza!
Third graders tally, sort, and organize pizza orders from monthly school sales. They create an advertising campaign to promote the School Pizza Sale, record the data in graph form, compare and contrast the tallies throughout the year,...
Curated OER
Trends of Snow Cover and Temperature in Alaska
High schoolers gather historical snow cover and temperature data from the MY NASA DATA Web site. They compare this data to data gathered using ground measurements from the ALISON Web site for Shageluk Lake. They graph both sets of data...
Curated OER
Graphing
Fifth graders create graphs based on climate in South Carolina. They read and interpret information in a chart and construct a graphy from the information in the chart. They create a spreadsheet using Excel and publish 2 graphs.
Curated OER
Your Just Desserts
Students write letters to town officials and local businesses asking for favorite dessert recipes. They tabulate their responses in a spreadsheet. Students turn their survey results into colorful graphs.
Curated OER
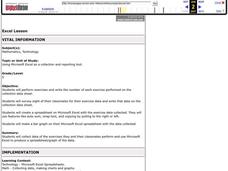
Excel Lesson
Fifth graders will perform exercises and write the number of each exercise performed on the collection data sheet. They survey eight of their classmates for their exercise data and write that data on the collection data sheet. They then...
Curated OER
MAISA and the REMC Association of Michigan
Students complete online research to study geography's impact on weather. In this geography and weather lesson plan, students research weather in their city for ten days using an online website. Students bookmark the site, enter data...
Curated OER
Lesson 3: Seven Day Road Trip
Students plan a seven day road trip. In this travel lesson plan, students plan a driving trip that includes five major cities or attractions in Florida or another state of their choice. They show the trip on a map, calculate distances...
Curated OER
School Yard Waste
Fourth graders examine the types of garbage that they collect on the playground. They collect the information in a spreadsheet and create a graph that displays the number of types of trash found. They design and monitor a playground...
Curated OER
Heartbeat Project
Students enter information about their heartbeats into a spreadsheet. They construct data displays and calculate statistics. They describe and justify their conclusions from the data collected.
Curated OER
Mmm, Mmm, M&M's
Here is another version of the classic M&M math lesson. In this one, upper graders utilize the ClarisWorks Spreadsheet program in order to document the data they come up with from their bags of M&M's. After making their initial...


