Yummy Math
Valentine’s Day = Roses
Roses are red, but did you know that some are lighter while others are darker? Scholars read an infographic to decipher the fraction and percent of rose color and their country of origin. They go on to make comparisons and estimate while...
Curated OER
Smaller Than One
Sixth graders practice converting a fraction into a decimal and a percent. They explain relationships among rational numbers. They order and compare whole numbers, fractions (including mixed numbers), and decimals using a variety of...
Curated OER
Exquisite Excursions
Students locate 6 cities, one on each of the 6 major continents. They find distance for each leg of their journey, convert to percents, use a time zone map, and convert to foreign currencies.
Curated OER
Finding Percent When Given A Fraction
Seventh graders calculate percentages when given a fraction. They convert a percentage to a fraction. All of this be done by each student's ability to read the graphs made available by the spreadsheet information.
Education World
The African American Population in US History
How has the African American population changed over the years? Learners use charts, statistical data, and maps to see how populations in African American communities have changed since the 1860s. Activity modifications are included to...
Yummy Math
US Holiday Candy Sales
Candy is a big business! Calculate the amount of money consumers spent on major holidays—Easter, Halloween, Christmas, Hanukkah, and Valentine's Day—based on the total amount of candy sales from 2011 and the percentage of each holiday's...
Curated OER
Meatiest States: Graph Problem Solving
In this graph problem solving learning exercise, students analyze a graph that shows commercial red meat production in five states. Students answer 5 word problems using the data on the graph.
Curated OER
Gold Rush California and its Diverse Population
Students compare contemporary cultural differences with historical differences based on population percentage. In this cross-curriculum Gold Rush/math lesson, students analyze aspects of California's Gold Rush population and diversity...
Curated OER
WHO Wants Clean Water! Do You? Solving Conflicts Over International Water Rights Issues
Students examine the water rights on an international scale. In this social studies lesson plan, students research on a specific water rights issue. They write a paper about their findings and create a PowerPoint presentation which they...
Curated OER
Stock Market Math
Students calculate commission for a stock transaction through a broker using the relationship between percentages and decimals. They decide which stocks are preferable based on the price to earnings ratios listed on the stock market quotes.
Curated OER
Health Enhancement Traditional Games
Fourth graders participate in Tribal games. In this tribal nations lesson, 4th graders play games that help improve on the physical skills for survival, invention, and problem solving. They discuss what is needed for survival and how...
Curated OER
"Water is Life" Global Water Awareness
Students examine and calculate the percentage of potable water remaining on the earth. In this ecology and geography instructional activity, students brainstorm the main factors affecting water distribution. Students use mathematical...
Curated OER
Water Pressure - Disparity of Resources
Students examine the disparity of resources between developing and industrialized nations, and research the problem of water availability as world populations increase and natural resources are stressed.
Curated OER
Light Bulbs Save Energy
Young scholars read a story called New Bulbs Provide More Light, Save Energyand answer vocabulary and comprehension questions about it. In this current events energy saving light bulb lesson plan, students respond to literature by...
Curated OER
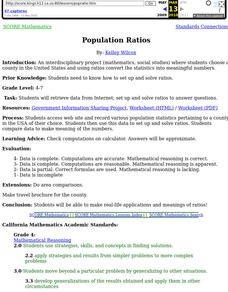
Population Ratios
Students access web site and record various population statistics pertaining to a county in the USA of their choice. They use this data to set up and solve ratios. They compare data to make meaning of the numbers.
Curated OER
Town Budget Meeting Simulation: Meeting Needs of Young and Old Lesson Plan
Students participate in a simulation in which they determine the town budget to help programs in their community for the young and old. In groups, they brainstorm a list of the needs of the young and old and share their thoughts on why...
Curated OER
Government Lesson Plan 19
Students define vocabulary terms related to monetary policies, and apply monetary tools to solve economic scenarios.
Curated OER
Texas History Math
Seventh graders practice math skills while they become familiar with Texas' Boom & Bust economy and the natural history of the east Texas Piney Woods.
Curated OER
Rediscovering Forgotten Women Writers
Women's voices are becoming more prominent in the world of literature, but for centuries, this wasn't the case. Young historians research a woman whose writings are considered to be lost, out of print, or forgotten. They develop an oral...
Curated OER
Your Tax Dollars at Work
In order to understand how tax dollars are spent, young economists use given data and graph it on a circle graph. Circle graphs are highly visual and can help individuals describe data. A class discussion follows the initial activity.
Curated OER
Global Women and Poverty
Students examine poverty and women in Senegal through a video. They work together to gather research about economic prosperity in different countries. They share their information with the class.
Curated OER
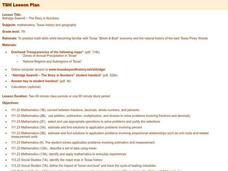
Aldridge Sawmill - The Story in Numbers
Seventh graders practice math skills while becoming familiar with Texas' "Boom & Bust" economy and the natural history of the east Texas Piney Woods. They utilize worksheets and websites imbedded in this plan.
Curated OER
Aldridge Sawmill - The Story in Numbers
Seventh graders view overhead maps of Texas, explore history of Aldrige Sawmill, and practice math skills while becoming familiar with Texas' "Boom & Bust" economy and natural history of east Texas Piney Woods.
Curated OER
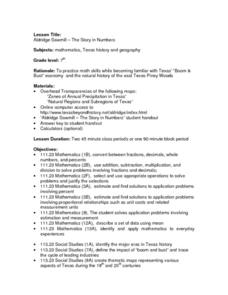
Aldridge Sawmill -- The Story in Numbers
Seventh graders view a recent transparency of the average rainfall zones of the state of Texas. Using another transparency, they identify the Piney Woods subregion of the Gulf Coastal Plain and locate national forests and sawmills. ...

