Hi, what do you want to do?
Curated OER
Rain Reasons
Students explore how climatic factors influence the growth of plants. They create an experiment to find how variations in water, light, and temperature affect plant growth and describe how precipitation and geography can affect the...
Curated OER
Nature's Air Conditioner
Learners observe the process of transpiration in leaves. They measure how much water a leaf gives off in a 24-hour period, calculate the volume, and answer discussion questions.
Curated OER
A Comparison of Land and Water Temperature
Students use the NASA website's Live Access Server to create a graph of surface temperature at two locations on earth. They analyze the data and then answer specific questions provided in this lesson. They also examine and compare the...
Alabama Learning Exchange
Alex: Scaling Down the Solar System
In this lesson students will work collaboratively to gain a better understanding of the vastness of space by scaling down the solar system. This lesson plan was created as a result of the Girls Engaged in Math and Science University,...
Science Education Resource Center at Carleton College
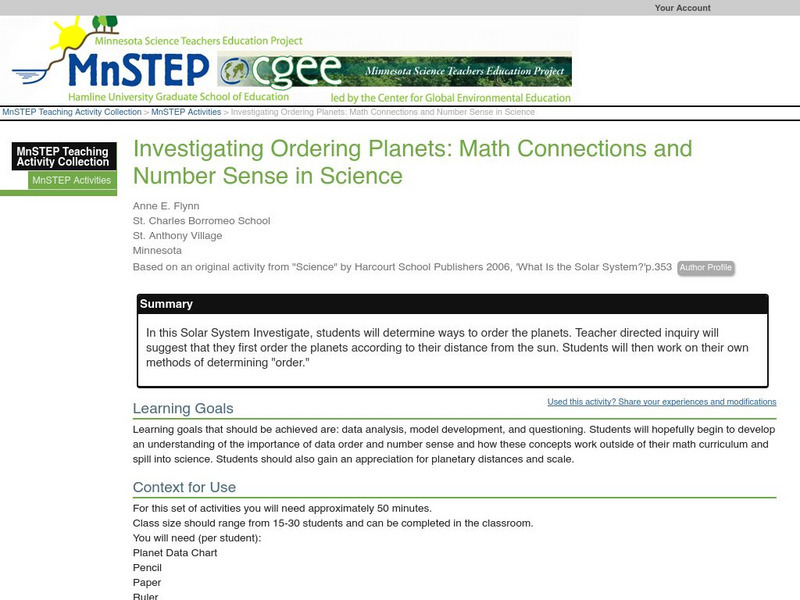
Serc: Investigating Ordering Planets: Math Connections & Number Sense in Science
In this Solar System Investigate, learners will determine ways to order the planets. Teacher directed inquiry will suggest that they first order the planets according to their distance from the sun. Students will then work on their own...
PBS
Pbs Teachers: Math Space Odyssey: How Much Do You Weigh in Outer Space?
Demonstrate the ability to apply the use of decimals, fractions, ratios and proportions to situations based upon given information about planets in the solar system.
Alabama Learning Exchange
Alex: Beyond the Earth Part Ii
A continuation of Beyond the Earth Part I. As part of a unit on the solar system, students will choose a component of the solar system to research. Students may use a variety of resources such as the Internet, books, and reference...
Alabama Learning Exchange
Alex: Beyond the Earth Part I
Students will access prior knowledge of the solar system by completing a graphic organizer. After participating in a teacher lecture and whole group discussion, the students will work in collaborative groups to create a...
Other popular searches
- Solar System Math Lessons
- Solar System Math Graph
- Solar System Math Age
- Solar System Math Ration
- Solar System Math Lessons'
- Solar System Math Worksheets
- Math Solar System
- Math Science Solar System
- Math and Science Solar System
- Solar System Math Lesson Plans
- Solar System Mathematics


