Curated OER
Parallel Lines and Properties of Slope
Students define functions to be graphed using the Y=key. They demonstrate how to set up a standard viewing screen using Zoom 6. They discuss and explore mathematical questions on a worksheet.
Curated OER
Writing Linear Equations in Different Forms
Can your class write linear equations three different ways? Here is a study guide that includes slope-intercept, standard, and point-slope forms. Learners are given the slope and a point on the line, or two points and are asked to write...
Curated OER
Practice: Word Problems
Congratulations, you've just hit the word problem jackpot! Covering an incredible range of topics from integers and fractions, to percents, geometry, and much more, this collection of worksheets will keep young mathematicians busy...
Balanced Assessment
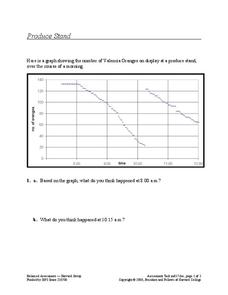
Produce Stand
Interpret a graph of the number of oranges at a produce stand to determine a likely event at different times. They also analyze the graph to determine which time period oranges were selling most quickly.
Curated OER
Linear Graph
Students solve linear equations and graph the different functions. In this algebra lesson, students graph piecewise functions using the slope and y-intercept and the given restrictions on the domain of the line. They discuss rate of...
Curated OER
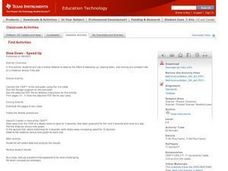
Slow Down - Speed Up
Pupils explore the concept of distance and time as they use a CBR to mimic distance v. time graphs. Learners walk towards and away from the monitor to create various distance v. time graphs, then discuss what motion creates certain graphs.
Curated OER
A.P. Calculus Exam Prep
In this A.P. Calculus exam practice test, students answer 28 multiple choice questions. Questions cover a wide variety of topics. Kids tell the position of a particle moving along a horizontal line. They identify the solution to a...
Curated OER
Logarithmic Functions
Learners explore the characteristics of logarithmic functions and their relationship to exponential functions. Using the subscriber website Explorelearning.com, pupils observe changes in the input variable and its effect on the graph of...
Curated OER
Hit the Slopes
Eighth graders work in one collaborative group to understand how ordered pairs are represented and graphed on a coordinate plane. They identify points on the coordinate plane and communicate their understanding of ordered pairs and their...
Curated OER
Graphing Linear Equations with Two Variables
Can your class solve linear equations in two variables? They will be able to after they engage in this lesson. Individuals graph linear equations in two variables using slope and intercept and identifying the relationship between the x...
Curated OER
Calculus Practice Exam
In this calculus worksheet, learners practice solving problems that will be on their calculus exam. They evaluate, take the derivative and find the slope of a tangent line. There are 28 questions.
Curriculum Corner
8th Grade Math "I Can" Statement Posters
Clarify the Common Core standards for your eighth grade mathematicians with this series of classroom displays. By rewriting each standard as an achievable "I can" statement, these posters give students clear goals to work toward...
Charleston School District
The Line of Best Fit
If it's warm, they will come! Learners find a line of best fit to show a relationship between temperature and beach visitors. Previous lessons in the series showed pupils how to create and find associations in scatter plots. Now, they...
Curated OER
Introduction to Mathematical Modeling
In this mathematical modeling activity, students answer two essay questions. They describe Newton's Law of Cooling by describing and constructing a model and answering seven essay questions about the process.
Curated OER
The International Space Station
In this International Space Station worksheet, students are given the altitude changes in the space station on a graph from 2000-2004. Students answer 5 questions about the trends in the graph, the changes in altitude, the reason for the...
Curated OER
My Peanut Butter is Better Than Yours!
Students explore the concept of statistical data. In this statistical data lesson, students read an article about the dangers of peanut butter to those who are allergic. Students perform a taste test of two different brands of peanut...
Curated OER
Linear Functions
For this linear functions worksheet, students problem solve and calculate the answers to five linear equations associated with volume, point-slope forms, initial value forms and slope-intercept forms.
Curated OER
Secant Line Approximation of the Tangent Line
Students perform operation with secant and tangent lines. In this calculus lesson, students find the derivative and relate it to the slope of a line. They differentiate between secant and tangent as they intersect a circle, using Cabri.
Alabama Learning Exchange
Graphing Stations
Students explore the concept of graphing stations. In this graphing stations lesson plan, students head to various teacher set-up stations involving slope, point-slope, standard form, parallel lines, etc. Students work problems at each...
Curated OER
Real-World Linear Equations
Eighth graders practice technology skills through the use of a spreadsheet and a discovery lesson focusing upon linear equations. The technology allows for the visual changes to be displayed for different lines of equations.
Curated OER
Whose Line is it Anyway?
Students solve systems of equations. In this algebra lesson, students identify the domain and range of each function. They use the slope and y-intercept to graph each line.
Curated OER
Pike's Peak Problem
In this algebra worksheet, students answer a word problem about a distance-rate multiplied by times problem. They discuss slope and altitude. There is an answer key with this problem.
Alabama Learning Exchange
Explore the Transformations of Linear and Absolute Value Functions Using Graphing Utilities
Students explore the concept of transformations. For this transformation lesson, students use an applet that is an interactive absolute value graph applet. Students manipulate the applet to examine the change in the function and how it...
Curated OER
Reading a Graph: Azimuth Range vs. Day in Barrow Alaska
Young scholars practice reading a graph while doing story problems. They determine the x and y intercepts and calculate the slope. They also practice writing linear equations.


