Curated OER
Expressing Geometric Properties with Equations
Algebra and geometry are not interchangeable. Demonstrate why not with a series of problems that deal with the equations of circles and equations of lines that meet specific criteria.
EngageNY
The Line Joining Two Distinct Points of the Graph y=mx+b Has Slope m
Investigate the relationship between the slope-intercept form and the slope of the graph. The lesson plan leads an investigation of the slope-intercept equation of a line and its slope. Pupils realize the slope is the same as the...
Curated OER
US Airports, Assessment Variation
Determining relationships is all part of algebra and functions. Your mathematicians will decide the type of relationship between airports and population and translate what the slope and y-intercept represent. The problem is multiple...
EngageNY
End-of-Module Assessment Task: Grade 8 Module 4
Connect proportional linear equations and systems. The seven-question assessment is the last installment in a 33-part series. The items cover comparing proportional relationships, slope concepts, and simultaneous linear equations. To...
Curated OER
Equal Differences Over Equal Intervals 2
Your algebra learners explore linear functions concretely using tables of values in a collaborative task. The idea that linear function values change by equal differences over equal intervals, is emphasized. The slope and y-intercept...
EngageNY
Characteristics of Parallel Lines
Systems of parallel lines have no solution. Pupils work examples to discover that lines with the same slope and different y-intercepts are parallel. The 27th segment of 33 uses this discovery to develop a proof, and the class determines...
Illustrative Mathematics
Distance across the channel
Here you will find a model of a linear relationship between two quantities, the water depth of a channel and the distance across the channel at water level. The cross section of the channel is the shape of an isosceles trapezoid. The...
Inside Mathematics
Graphs (2007)
Challenge the class to utilize their knowledge of linear and quadratic functions to determine the intersection of the parent quadratic graph and linear proportional graphs. Using the pattern for the solutions, individuals develop a...
Curated OER
US Population 1982-1988
Your algebra learners make predictions using the concepts of a linear model from real-life data given in table form. Learners analyze and discuss solutions without having to write a linear equation.
Concord Consortium
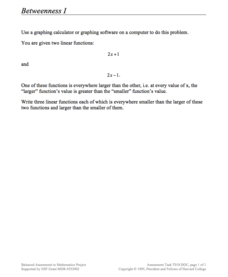
Betweenness I
Just between us, this is a pretty cool lesson! Given two functions with the same slope, learners write three new functions whose outputs are all between the given functions. The question is open-ended, allowing pupils to explore the...
Illustrative Mathematics
Downhill
A car traveling down a steep hill is the model for this resource. The confusion comes when the elevation, E, is given in terms of distance, d. The distance, d, is the horizontal distance from E. Therefore, the equation, E = 7500 – 250d,...
Inside Mathematics
Squares and Circles
It's all about lines when going around. Pupils graph the relationship between the length of a side of a square and its perimeter. Class members explain the origin in context of the side length and perimeter. They compare the graph to the...
EngageNY
Constant Rates Revisited
Find the faster rate. The resource tasks the class to compare proportional relationships represented in different ways. Pupils find the slope of the proportional relationships to determine the constant rates. They then analyze the rates...
Curated OER
Equal Differences Over Equal Intervals 1
Learners explore linear functions concretely using tables of values in a cooperative task. The concept of the values of linear functions changing by equal differences over equal intervals of one is emphasized. Learners will discover the...
Illustrative Mathematics
Chicken and Steak, Variation 2
Many organizations put on barbecues in order to make money. In a real-world math problem, the money allotted to purchase steak and chicken at this barbecue is only one hundred dollars. It is up to your potential chefs to figure out how...
Charleston School District
Pre-Test Unit 9: Scatter Plots
What do your classes know about statistics? Use a pre-test to determine their background. Topics include scatter plots and lines of best fit, two-way frequency tables, and modeling with linear equations.
Mt. San Antonio Collage
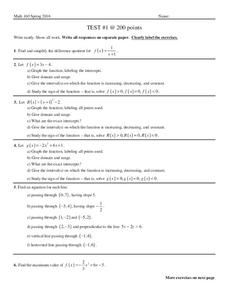
Test 1: Graphing Functions
Graph the night away with all the different types of functions provided in the worksheet. Linear, quadratic, and rational all ask for graphs, domain and range and other key factors about the functions.
Curated OER
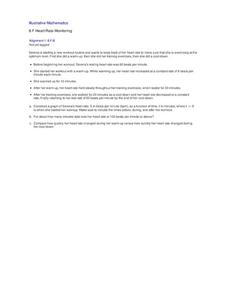
Heart Rate Monitoring
Algebra learners like this resource because it is easy to understand and it relates to their lives. Whether you are starting a new workout routine, or just climbing the stairs, your heart rate increases and decreases throughout the day....
Curated OER
What Functions do Two Graph Points Determine?
Your algebra learners write linear, exponential, and quadratic equations containing the same two graph points in this collaborative task.
Curated OER
Buying Coffee
Starbucks or house blend? Pupils analyze the unit rate as the cost per pound of coffee. They use a graph to visualize the unit rate given the cost for a quantity other than one pound.
EngageNY
Analyzing a Graph
Collaborative groups utilize their knowledge of parent functions and transformations to determine the equations associated with graphs. The graph is then related to the scenario it represents.
CCSS Math Activities
Smarter Balanced Sample Items: 8th Grade Math – Claim 2
Math can be a problem in eighth grade. Sample items show how problem solving exists within the eighth grade standards. Part of the Gr. 8 Claim 2 - 4 Item Slide Shows series, the presentation contains eight items to illustrate the...
Illustrative Mathematics
Equations of Lines
The intent of this resource is to show algebra learners that there is a proportional relationship between two lines that have an intersecting point. As the coordinate x increases by a constant, the y coordinate also increases. It will...
Mathematics Assessment Project
College and Career Readiness Mathematics Test C1
Challenge high schoolers with a thorough math resource. The 20-page test incorporates questions from upper-level high school math in applied and higher order questions.


