USA.gov
How The Supreme Court Works
Just how does a case come before the highest court in the land? A graphic flow chart unpacks how plaintiffs come before the Supreme Court. Graphics include background on the nine justices and just how many cases they actually hear each...
Tom Richey
Slide Share: Making Connections
A slide show with thirty-two slides explaining how to use text to self, text to text, and text to world connections to improve reading comprehension.
Scholastic
Scholastic Teaching Resources: Informational Reading Response [Pdf]
This graphic organizer can be used with students when they read informational text. Students will write three facts they learned, two questions they still have after reading, and one interesting fact that they want to share.
Sophia Learning
Sophia: Reflecting on Reading
This lesson explains the reading strategy of reflecting on reading. This tutorial lesson shares a short slideshow with the lesson's content.
Polk Brothers Foundation Center for Urban Education at DePaul University
De Paul University: Center for Urban Education: Read to Learn, Share What You Learn [Pdf]
Several tips for reading to learn are provided on this page. Students will explore the BIG idea presented in a nonfiction piece.
Tom Richey
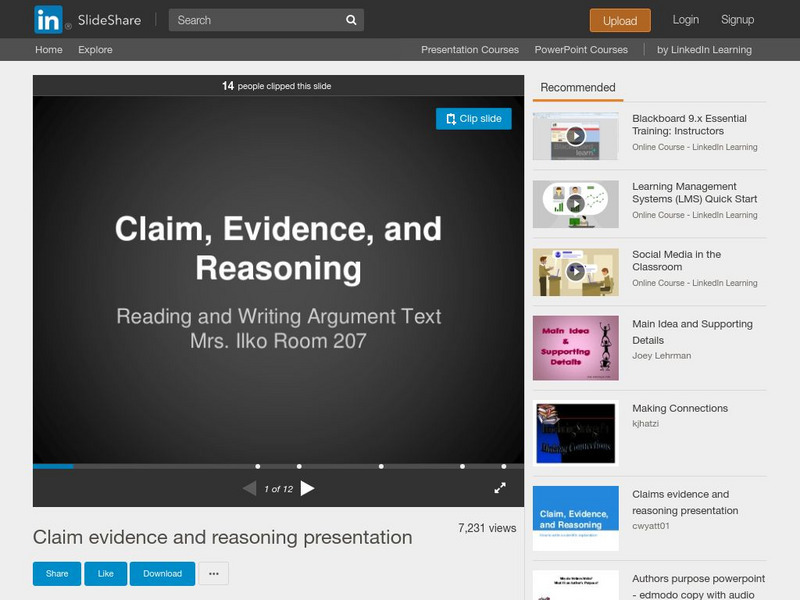
Slide Share: Claim Evidence and Reasoning
A slideshow with twelve slides about reading or writing an argument, analyzing the claim and looking at how it is supported with observation, evidence, and reasoning.
Tom Richey
Slide Share: Prediction and Inference: A Reading Strategy
This downloadable slideshow focuses on prediction and inference including the similarities and differences between them, when the reader does each, and questions to ask as you are reading.
Sophia Learning
Sophia: Reading Rates
This lesson explains the different rates of reading. This tutorial lesson shares a short slideshow with the lesson's content.
Tom Richey
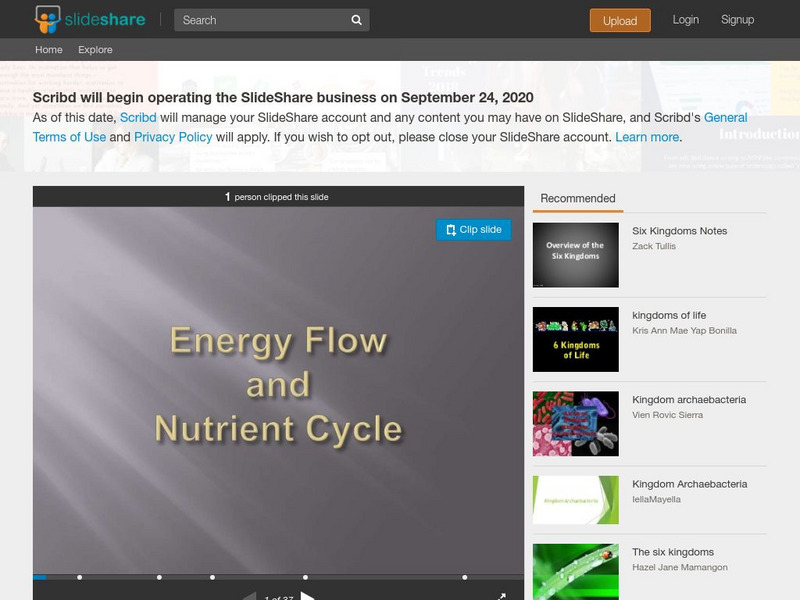
Slide Share: Energy Flow and Nutrient Cycle
Read 37 slides on energy flow and the nutrient cycle.
Polk Brothers Foundation Center for Urban Education at DePaul University
Depaul University: Center for Urban Education: Take Show and Tell [Pdf]
Students will use this graphic organizer to show their understanding of what they have read. Afterward, students will share the illustrations with their peers and explain how their pictures connect to the text.
Polk Brothers Foundation Center for Urban Education at DePaul University
De Paul University: Center for Urban Education: Utiliza El Demuestra Y Cuenta Para Representar [Pdf]
Students will use this graphic organizer to show their understanding of what they have read. Afterward, students will share the illustrations with their peers and explain how their pictures connect to the text. The directions for this...
Other
Understanding Dyslexia: What Are the Effects of Dyslexia
This infographic was developed to share a look at the effects of dyslexia.
Georgia Department of Education
Ga Virtual Learning: Fable Chart [Pdf]
This is a PDF Fable Chart designed for students to complete as they read a fable; it includes the title and author, the animal character, human characteristics, the individual elements of a short story, and the moral or lesson.
Sophia Learning
Sophia: Parentheses
This lesson introduces parentheses and how they are used. This tutorial lesson shares a short slideshow and provides review questions over the lesson's content.
BBC
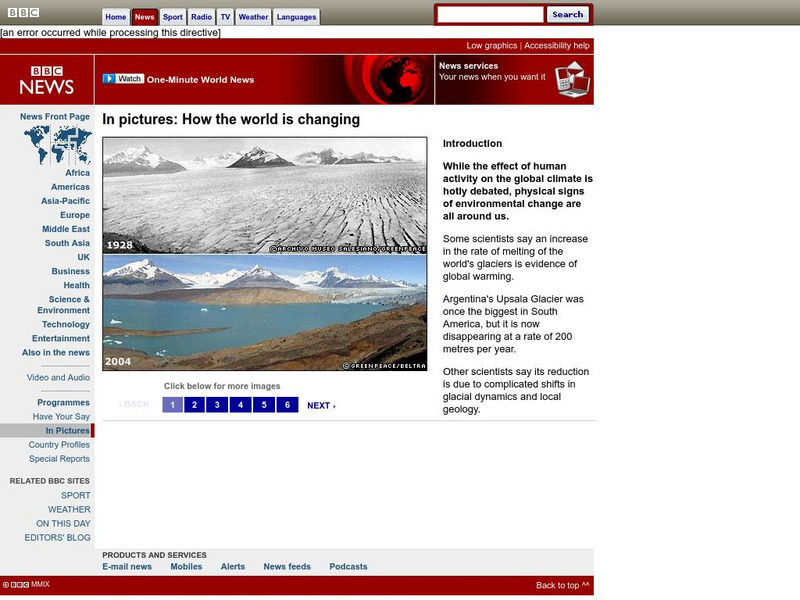
Bbc News: In Pictures: How the World Is Changing
View and read about climate change by comparing two images of the same location at different times.
Curated OER
Bbc News: In Pictures: How the World Is Changing
View and read about climate change by comparing two images of the same location at different times.
Curated OER
Scholastic: Lewis and Clark
An interactive site that has students follow the Lewis and Clark's expedition. As they travel west, they are able to collect objects on their journey and put them in their specimen box. They also take notes on their specimens so they can...
Other popular searches
- Kindergarten Shared Reading
- Shared Reading Lesson Plans
- Shared Reading Lessons
- Shared Reading Owl Moon
- Shared Reading and Science
- Shared Reading Experience
- Shared Reading and Math
- Shared Reading Strategy
- Shared Reading Non Fiction
- Shared Reading Stellaluna
- Shared Reading Lessons Rome
- Shared Reading Inferences


![Scholastic Teaching Resources: Informational Reading Response [Pdf] Graphic Scholastic Teaching Resources: Informational Reading Response [Pdf] Graphic](https://content.lessonplanet.com/knovation/original/261457-b11bd4d074a51abd27ef520fb690e45a.jpg?1661510812)

![De Paul University: Center for Urban Education: Read to Learn, Share What You Learn [Pdf] Graphic De Paul University: Center for Urban Education: Read to Learn, Share What You Learn [Pdf] Graphic](https://d15y2dacu3jp90.cloudfront.net/images/attachment_defaults/resource/large/FPO-knovation.png)


