Curated OER
Pi Digit Distribution
Students study graphing skills and compare and contrast data sets. They compute pi through the first 50-100 digits and create a bar graph showing the frequencies of specific digits.
Curated OER
We Are Having a Party! Part I
Second graders use data analysis skills in order to plan a class party. They graph possible times for the party noting the range for times. They discuss how mathematicians find and use the range to analyze data.
Curated OER
Central Tendencies and Normal Distribution Curve
Fourth graders are given data (class test scores) to determine central tendencies, and find information needed to construct a normal distribution curve. They become proficient in calculating mode, median and average.
Curated OER
The Guise of a Graph Gumshoe
Eighth graders practice constructing bar, circle, and box-and-whisker graphs. They practice reading and interpreting data displays and explore how different displays of data can lead to different interpretations.
Curated OER
Live, From New York
In this data analysis worksheet, learners study the information on a data table about the hosts of Saturday Night Live. Students answer 8 problem solving questions about the table.
Curated OER
Deciding Which Type of Graph is Appropriate
In this graphing worksheet, students read about line, bar, and pie graphs and then determine which graph is the best way to express data results. This worksheet has 3 short answer questions.
Curated OER
Making Data Meaningful
In this sample mean learning exercise, learners explore different ways "average" is used. Students use this information to find the sample mean of the height of a large class of learners. Students find the mean, median, mode and range of...
Curated OER
Alien Plant Invasion: A Filed Study project at Saguaro National Park
Learners are able to describe the purpose of National Parks and Monuments. They describe three ways alien plants species affect native populations of plants and animals. Students are able to properly set up a study plot, measure and...
Curated OER
Find the Mean #6
In this find the mean #6 worksheet, 5th graders find the mean for 6 sets of numbers and write it in the box.
Curated OER
Find the Mode #3
In this find the mode #3 activity, 5th graders find the mode for 6 sets of numbers and write it in the box.
Curated OER
Fitness Analysis
Students study how to monitor their personal status of their body composition. They study how to monitor and adjust activity levels to meet personal fitness needs and demonstrate objectives 1 and 2 by using the software provided by Furtex.
Curated OER
Mean, Median, and Mode
Students find the mean, median, and mode for a set of data. They define terms and find examples, as well as complete practice exercises. They work cooperatively to analyze real data from a variety of websites provided. To...
Curated OER
Linear and Exponential Models
Students linearize data to determine if an exponential model is suitable. For this linearizing data to determine if an exponential model is suitable lesson, students graph the residuals of sets of data that appear to have an exponential...
Curated OER
Curve Fitting
Pupils investigate linear, quadratic, and exponential regressions. They plot sets of data points, determine the regression equation that best fits the data and lastly investigate the coefficient of determination.
Curated OER
Climatographs
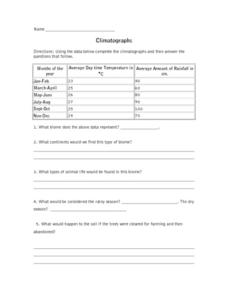
In this climatographs worksheet, students are given 3 sets of data of the rainfall and temperature for 3 different biomes. Students identify the types of biome for each and answer questions about each. They make 2 graphs to compare the...
Curated OER
Model and Solve Algebraic Equations
Examine multiple ways to solve algebraic equations. Pupils will generate a problem solving strategy that addresses the prompt given by the teacher. They will then share their problem solving strategy with the class. Graphic organizers,...
Curated OER
The Histogram
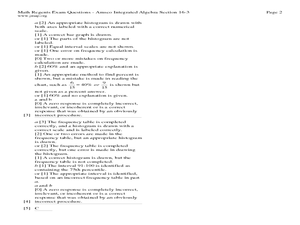
In this Algebra I/Algebra II worksheet, students construct and analyze histograms to develop a visual impression of the distributions of data. The two page worksheet contains five problems. Answer key is provided.
Curated OER
Specific Heat of Air and Soil
Students are introduced to the concept of specific heat. In groups, they are given a set of data showing the temperatures of air and soil samples in which they calculate the ranges of the data. They identify whether the air or soil...
Curated OER
Buzzing is BEE-lieving
Students investigate insects. In this insect lesson, students explore various insect models and identify the characteristics of each. Students observe insects outside and tally how many insects they observe.
Curated OER
Weather With a Latitude
Students read the temperature from a thermometer. In this weather lesson, students read a thermometer and record the temperature at twenty minute intervals. Students discuss results.
Curated OER
Find the possible values for the Median
In this online math learning exercise, students find values for the median given a variety of sets of data. This excellent resource allows the students to check their answers, and to get "hints" should they run into difficulties. A...
Curated OER
High Frequency Words: Set 4
Three pages plus twelve words equal a versatile resource ready to use. Here is a set of twelve high frequency words that you can print and cut to reinforce high frequency word recognition. Great for early readers, autistic learners, or a...
Digital Forsyth
Photo Analysis for Visual Impact
A lesson on photo analysis, compare and contrast, and an art project are here for the taking. Fourth graders analyze photographs of gas stations from now and from the past, focusing on how the cars and building designs are a form of art....
Curated OER
Weather temperatures
Students investigate the given statistics about temperatures in cities around the nation in order to look for a pattern. They measure the mean, median, and mode for the data set of temperatures.
Other popular searches
- Data Set
- Analyzing Data Set
- Circle Graph Data Set
- Data Set Experiments 2nd
- Data Set Experiments
- Data Set Table
- Data Set Planets
- Mode of a Set of Data
- Socrates Data Set
- Line Graph Data Set
- Socrates Graph Data Set


