Curated OER
Math Facts Race
Learners reinforce math-facts knowledge and understanding, contribute to a team effort and carefully observe the actions of all team members by playing a game to practice addition, subtraction, or multiplication facts.
IMSA
Geometric Transformations with Matrices
In this math worksheet, learners find the values associated with the geometric transformations. They read the instruction sheet for completing matrices with translations, rotations, reflections, and scaling by adding and multiplying...
Curated OER
Biodiversity Memory Match Up
Students are introduced to the animals of Asia. In this biodiversity lesson, students use interactive maps to identify animals from Asia, then play a memory game to reinforce the information.
Curated OER
Growing Rock Candy
Students observe the growth of rock candy. In this crystal growth lesson, students make rock candy and measure the crystal growth over five days.
Curated OER
Designing the Toy Planet Store
Sixth graders create a grid of their fictitious store. In this measurement lesson, 6th graders use a computer to measure out the floor of their store and create furniture, doorways, windows, and more. This lesson includes directions for...
Curated OER
Magic Square Trig Identities
In this trig worksheet, 12th graders review their trig identities using a table. They answer questions 1-16 as given clues to find the answer to the correct identity.
Curated OER
The Atom Board-Making Atoms
In this making atoms science activity, students read about the atomic number of protons, finding the number of neurons, and how electrons function before they complete the atom board graphic organizer and respond to 4 short answer...
Curated OER
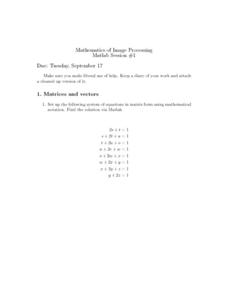
Matrices and Vectors
In this matrices and vectors instructional activity, students solve 9 various types of problems related to forming matrices and vectors. First, they set up each system of equations listed in matrix form using mathematical notation. Then,...
Curated OER
DASH Sunrise and Sunset/ Seasons Chart
Second graders rotate as the person to enter the information of sunrise and sunset into a spreadsheet. The teacher also demonstrates how to convert the spreadsheet into a chart.
Curated OER
1 VS the Mob
Students prepare to become the first to cover four adjacent products, horizontally, vertically or diagonally by selecting factors that make the needed products. They play this game to acquire a healthy appetite for competition between...
Curated OER
Pet Count Excel Graphing
Students used collected data to distinguish what pets they have or would like to have. They correlate findings with appropriate technology--Excel. At the end of the lesson they tabulate a bar chart and present their findings to the class.
Curated OER
Weights and Measures
Students master the gathering, averaging and graphing of data. They practice conversion to metric measures. They gain fluency in the use of technology tools for math operations.
Curated OER
Temperature Graphing
Fifth graders analyze temperature variations throughout the world by using computer graphing of select major national and international cities.
Curated OER
Temperature Graphing
Students analyze temperature variations throughout the world by using computer graphing of select major national and international cities. After analyzing their findings, students write a paragraph explaining their data.
Curated OER
Sportsround
Students devise a plan to help get kids more active by encouraging them to participate in sports. Student, using spreadsheets, devise a weekly exercise timetable for a fitness fanatic and a realistic one of themselves.
Curated OER
Constellations
In this constellations worksheet, learners write their name as a constellation using an x and y-axis graph. This worksheet has 1 graph to create.
University of Cambridge
University of Cambridge: Nrich: What Shape and Color?
Fill in the chart and see which shapes and which colors belong in which rows and columns. The solution is readily available at this one page website.


