Curated OER
Frequency Tables - Home Link Support
In this home school support worksheet, 2nd graders, with a home support person, review the use of frequency tables to organize and display data. They make their own frequency table and read it with the support person.
Curated OER
Everyday Mathematics: Coins
In this counting coins worksheet, students receive help from an adult to find the total value for the pictured coins. The objective is to enhance students' counting money skills and skip counting skills.
Curated OER
Everyday Mathematics at Home
Send this information home with your young learners. Adults, siblings, or friends can help youngsters learn how to measure! This gives basic tips and suggests having the child draw a series of lines, and then use their 10-centimeter...
Curated OER
Creating Exponents
In this exponent instructional activity, students convert given powers of ten into exponents and they convert exponent numbers into powers of ten.
Illustrative Mathematics
Sarah, the chimpanzee
Is Sarah, the chimpanzee, smart or just a lucky guesser? Here, learners set up a simulation and read a dotplot to find out the likelihood of getting 7 out of 8 questions correct. One suggested modification would be to have your class...
Curated OER
Loon Chase
In this math and science in literature worksheet, learners read the story 'Loon Chase' and answer the 10 math or science questions for the text.
Curated OER
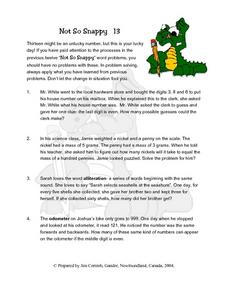
Snappy Thirteen
in this math worksheet, students work on the problems with the basic skills of arithmetic. The context is using the number 13.
Curated OER
Double Data
For this data worksheet, students answer 4 questions about a double line graph. For example, "How can you use the graph to figure out when each alligator grew the most?"
Curated OER
Communicating Data
In this data worksheet, students match information with the best type of graph to display it. Students also make a chart and graph to display information in a given paragraph.
Curated OER
Degrees and Minutes
In this latitude and longitude worksheet, middle schoolers place 9 cities on a map using the latitude and longitude of each. Once cities are placed in the correct location, students complete 2 short answer follow-up questions.
Curated OER
Baking Soda vs. Baking Powder
In this chemical reactions worksheet, students by comparing the chemical reactions of baking soda and baking powder. This worksheet has a graphic organizer and 7 short answer questions.
Curated OER
Meat Processing
In this meat processing worksheet, students learn how nitrates are used as curing agents for meat and how tenderizers work. Students compare meat treated with nitrates with meat that has not been treated. Students complete 8 short answer...
Curated OER
Protein Coagulation or Denaturation
In this proteins worksheet, learners compare the coagulation of egg whites and milk proteins and then complete 5 short answer questions. A protein coagulation quiz is also included with 5 multiple choice questions.
Curated OER
Gastrointestinal Illness Strikes
In this epidemiology worksheet, learners read a scenario about people reporting an acute episode of gastrointestinal illness. Students determine if its an outbreak and then complete 4 short answer questions.
Curated OER
Challenges of Sampling
In this sampling worksheet, students try different sampling methods to determine which is the best for determining contamination on a substance. This worksheet has 5 short answer questions.
Curated OER
Food Energy
In this food energy worksheet, students review calories and how calories are determined. Students calculate how much thermal energy it would take to raise certain volumes of water a certain number of degrees. This worksheet has 3 word...
Curated OER
Particle Models
In this particle model worksheet, students solve and complete 14 various types of problems. First, they find the magnitude of the side or the angle indicated with a question mark for each triangle illustrated. Then, students find the x...
Curated OER
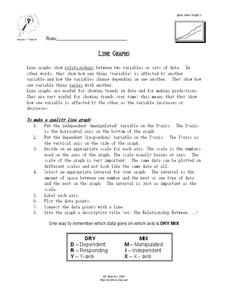
Line Graphs
In this algebra worksheet, young scholars describe the relationship between a line graph and its data. They define the reasons line graphs are used and discuss increasing and decreasing lines. There is one involved questions, requiring...
Curated OER
Scatter Plots
In this Algebra I/Geometry/Algebra II worksheet, students create a scatter plot and analyze the data to determine if the data show any type of correlation. The four page worksheet provides extensive explanation of topic,...
Curated OER
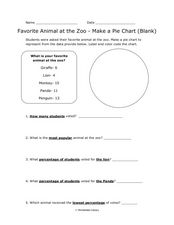
Pie Chart: Favorite Animal at the Zoo
In these three interpreting a pie chart and answering questions worksheets, students use the data provided to label and color code the blank and outlined pie charts, read and interpret a completed pie chart, and then answer questions...
Curated OER
Warm-up #7b -- Hair Raising!
In this reasoning worksheet, students use deductive reasoning to determine which people purchased a haircare item. They complete and record 7 steps to find the answer.
Curated OER
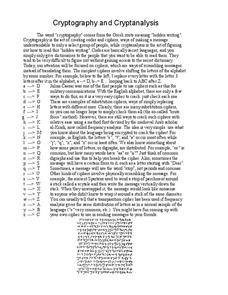
Cryptography and Cryptanalysis
In this cryptography and cryptanalysis worksheet, 8th graders read the explanation and example for codes and ciphers, then answer 2 questions and decipher 2 messages.
Curated OER
Name Scramble: African Ungulates
In this language arts and science worksheet, young scholars analyze 10 pictures of African ungulates (hoofed animals) with scrambled names. Students decipher the names and write them correctly under each picture.
Fluence Learning
Writing About Informational Text: Beyond the Beyond—Galaxies
Everyone has a different point of view, even when it comes to the enormity of the universe. Two separate text passages explain the scope of a galaxy, prompting young readers to write an essay about each author's argument and how the...
Other popular searches
- Math and Science
- Math and Science Careers
- Integrated Math and Science
- Science/ Math Games
- Math and Science Activities
- Integrating Math and Science
- +Math and Science Careers
- Math and Science Plan
- Math in Science
- Math Science
- Math and Science Lessons
- Math and Forensic Science


